Table of Contents
Indian and global markets face sharp swings amid tariff uncertainty and central bank policy shifts in the weekly macroeconomic analysis
The week of 7 April 2025 was one of the most volatile weeks as the markets had sharp up-and-down movements during the week. The key reason driving the volatility remains Trump’s tariffs. However, there has been a twist to this with a 90-day tariff pause from Trump. The global markets faced uncertainty, and investor sentiment appeared unsettled with widespread concern about what might happen next. In light of this, in this blog let us look at the weekly macroeconomic analysis and financial market insights.
Indian Economy Update
During the week, the Indian markets were highly volatile, with the highest downtrend seen on 7 April 2025 (Monday), where the Sensex fell by around 2,900 points and the Nifty 50 index corrected by 1,600 points. It is also said that this was the ‘Black Monday’ for the stock markets. After the 2020 COVID crash when the Nifty 50 fell by 10.7% in a single day in March 2020, this was the major crash in a single day that was reported. The reason being the same is the ongoing trade war issue between the US and India.
However, the market recovered after the fall by the close of the week, with the Nifty reaching 22,844 from a bottom of 21,740, and the Sensex recovered to 75,227 from a bottom of 71,430. In the below-mentioned picture, we can see the volatility of the index:
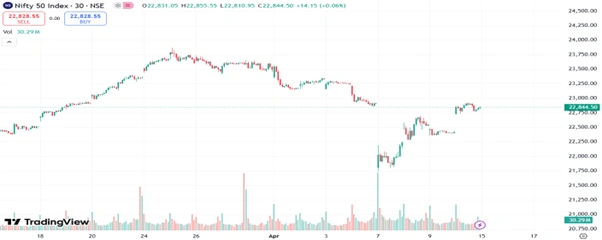
Source: Tradingview
Moreover, on 9 April 2025, Wednesday, the RBI MPC meeting concluded, which was headed by Sanjay Malhotra, the RBI Governor. In the meeting, the decision was passed to cut the repo rate by 25 basis points from 6.25% to 6%. The reason was to save the economy from Trump’s tariffs and the global recession. Also, the inflation in India had cooled down to 3.6% as of February 2025.
Looking at the outlook, the full-year forecast by the central bank has projected GDP growth at 6.5%, which was 6.7% earlier. Also, the full-year CPI inflation forecast has been reduced from 4.2% to 4%. Further, the quarterly bifurcation was given in this format:
| Quarter | GDP Forecast | CPI Inflation Forecast |
| Q1FY26 | 6.5% | 3.6% |
| Q2FY26 | 6.7% | 3.9% |
| Q3FY26 | 6.6% | 3.8% |
| Q4FY26 | 6.3% | 4.2% |
US Economy Update
One of the most significant updates that every investor and people around the globe were expecting was negotiations on tariffs. Finally, on 9 April (Thursday), President Trump proposed a resolution to all this by announcing a 90-day pause on tariffs across the globe. However, this still includes a base tariff of 10% for other countries. All countries have received a pause except China, and the tariff still applies to China as high as 125%.
Because of this update, the US markets soared to record highs on the same day, where the Nasdaq Composite was up by 12.1% in a single day, and the S&P 500 gained 9.5%. The key reason was the tariff pause, which opened the doors for trade negotiations between all countries, and a mutual solution was figured out, which was beneficial for all countries.

Source: Tradingview
The US CPI data for March 2025 was released on Thursday, which was reported at 2.4%, compared to 2.8% in February 2025. This is the first time it has fallen so much on a monthly basis. From the image below, we can see the trend of inflation in the US.
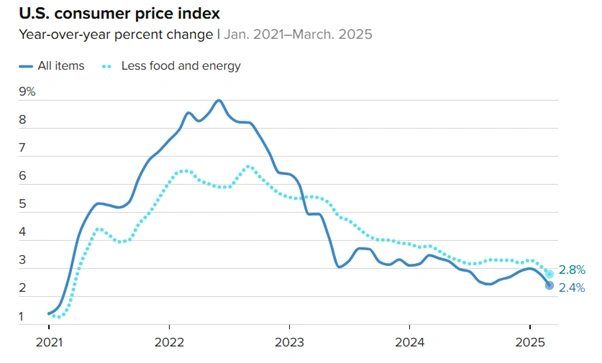
Source: CNBC
The US Treasury bond yields rose as the tariff war tensions persisted. With the increase in yields, US Treasuries gave negative returns due to their inverse relationship. During the week, the yields rose above 4.5% compared to 4% in the prior week.
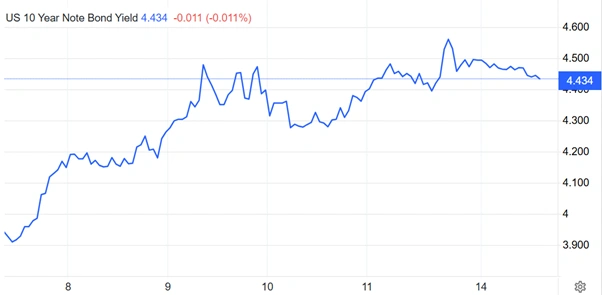
Source: Tradingeconomics
China Economy Update
Although the tariffs were paused for other countries, the trade war between the US and China became more severe. In the beginning, the US imposed a 20% tariff on Chinese goods. In retaliation, China also imposed a 34% tariff on US goods, effective from 10 April 2025. In response to China’s 34% tariff, the US increased its tariff on China to 84%, effective from 9 April 2025. Further, China retaliated again by applying an 84% tariff on the US effective from 10 April 2025. The US then escalated the trade war by raising the tariff on Chinese goods to 125%. In response to this, China also increased its tariff on US goods to 125% on 11 April 2025. Due to this, the SSE Composite Index ended 3.2% lower at 3,239 levels compared to the previous week’s close.
This trade war between both countries has become more intense. President Trump stated that China has disrespected the US, which is why they are imposing tariffs. On the other hand, China is also not willing to step back.

Trade War Between US and China
Japan Economy Update
Japan is deeply concerned about the ongoing tariffs, especially the ones expected to be imposed on one of their key sectors, automotive exports. Due to this uncertainty, investors shifted their investments toward the yen, resulting in the yen appreciating against the US dollar, moving to 142 from the prior week’s range of 147. Also, the 10-year bond yield in Japan increased from 1.18% to 1.36% . Investors are becoming very cautious amid the ongoing global trade war.
Other Major Economy Update
Even the European and other global markets also faced a significant decline on the first day of the week, 7 April 2025 (Monday). Gradually, by the close of the week, the markets tried to recover. Below is the list of a few major economies that faced a significant single-day drop:
| Index | Country | Change (%) |
| Nikkei 225 | Japan | -7.83 |
| Hang Seng | Hong Kong | -13.22 |
| Shenzhen Composite | China | -9.66 |
| S&P/ASX 200 | Australia | -4.23 |
| KOSPI | South Korea | -5.57 |
| Taiwan SE | Taiwan | -9.7 |
| Sensex | India | -3.6 |
| Dow | United States | -5.5 |
| S&P 500 | United States | -5.97 |
| NASDAQ | United States | -5.82 |
| STOXX Europe 50 | Europe | -5.34 |
| FTSE 100 | United Kingdom | -5.09 |
Source: Tradingview ( 7 April 2025)
Commodity Market Update
Gold: During the week, based on the macroeconomic indicators, gold prices once again successfully reached a new record high, with MCX Gold hitting 93,940. The key drivers behind this rally remain the ongoing trade war and the weakening of the dollar.
Crude Oil: Crude oil refinery inputs were 15.6 million barrels per day , an increase of 69,000 barrels per day from the prior week as refineries utilized 86.7% of their capacity. Crude imports fell to 6.2 million barrels per day, decreasing by 277,000 barrels per day from the previous week.
Natural Gas: The natural gas storage was 1,830 billion cubic feet (Bcf) , a net increase of 57 Bcf from the week before. This is 450 Bcf less than the comparable week last year and 40 Bcf less than the five-year average of 1,870 Bcf, but still within the range of history.
Major Events for Coming Week
| Date | Country | Event |
| 14-Apr-25 | India | CPI (March 2025) |
| 15-Apr-25 | India | Trade Deficit Data (March 2025) |
| 17-Apr-25 | US | Jobless Claims |
| 17-Apr-25 | Europe | ECB Interest Rate |
Conclusion
Looking at the global economic trends, the overall outlook for the coming weeks remains uncertain as the tariffs have not been completely removed, only paused, and all countries are engaging in trade deal discussions which may help in figuring out a mutual solution, while looking at the economic policy analysis, the RBI is making efforts to boost the economy through rate cuts, so investors need to carefully make their investment decisions and can make use of various online platforms to conduct research and make informed investment choices.
DISCLAIMER: This article is not meant to be giving financial advice. Please seek a registered financial advisor for any investments.

- Top 10 Investment Options in India for 2026 Ranked - May 19, 2026
- New Tax Regime vs Old Tax Regime 2026: Which Should You Choose? - May 14, 2026
- Oil Prices in India to go up? Why has the PM Advised on Curbs - May 12, 2026