Table of Contents
Want to stay ahead in the market? Explore key continuation chart patterns that help traders ride trends with confidence. Learn how to spot breakouts effectively
Chart patterns are formations created by price on a price chart. These patterns help in tracking the mood of buyers and sellers and give an early indication as to whether the price is more likely to sustain its trend or reverse. There are two major types of chart patterns – continuation and reversal patterns.
This blog highlights some of the most widely used technical analysis continuation patterns.
What are Continuation Patterns?
Continuation chart patterns are price formations that indicate that the price is most likely to continue in its current trend. Continuation patterns can indicate a continuation of both uptrends and downtrends.
These patterns are formed when buyers (in an uptrend) and sellers (in a downtrend) book partial profits, or they simply wait and watch for signals for the continuation of the trend. When they get these signals in the form of economic data, news, or corporate results, they continue with their buying or selling. Thus, the trend continues.
In simple words, Continuation chart patterns are temporary periods of sideways consolidation or a move against the prevailing trend. Now, let us look at some common continuation patterns in forex trading and other markets as well.
Ascending and Descending Triangle Patterns
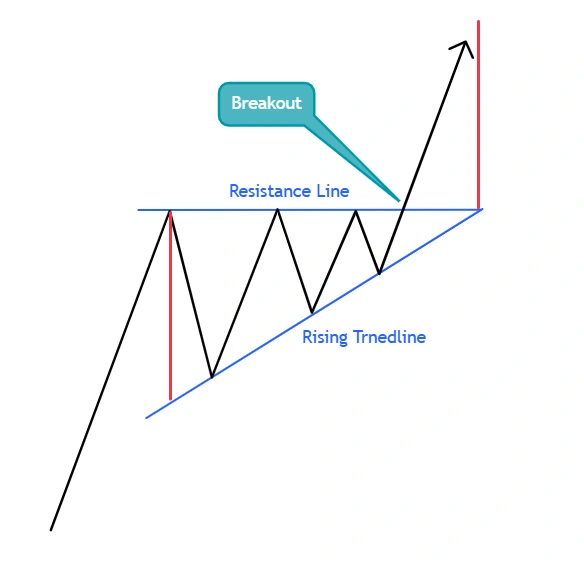
As suggested by the name, ascending and descending triangle patterns appear like triangles on a price chart. A formation and a breakout from these patterns signifies a continuation of a trend. An ascending triangle forms in an uptrend, and a descending triangle forms in a downtrend. An ascending triangle pattern forms between a resistance line and a rising trendline, indicating buying pressure. As you can observe in the diagram below, the breakout above the resistance line marks the completion of the ascending triangle pattern.
Ascending Triangle Pattern
Traders buy the stock after the breakout from the ascending triangle pattern. The height of the triangle pattern (red vertical line), is taken as the profit target after breakout, and stop loss is placed right below the resistance line. Traders also consider other factors for confirmation during breakout, such as volume.
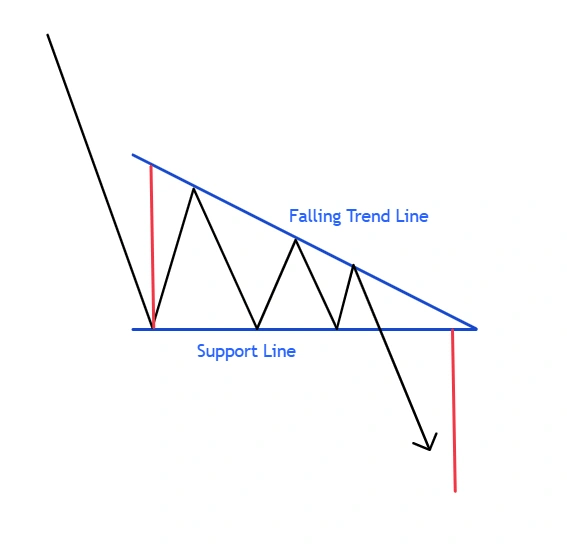
A descending triangle pattern is exactly the opposite of the ascending triangle pattern. It forms between a falling trendline and a flat support line and suggests a continuation of the downtrend. The methods of using price targets and stop-losses remain the same.
Descending Triangle Pattern
Symmetric Triangle
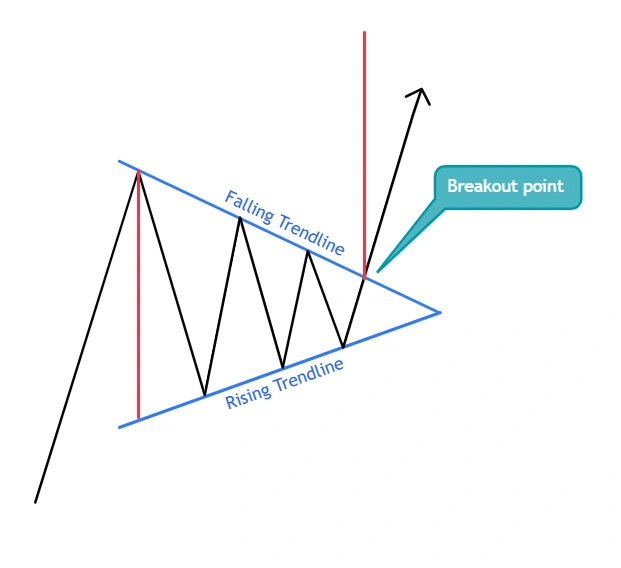
The symmetric triangle pattern forms between a rising and falling trendline. This pattern can form in both uptrend and downtrend, and its formation remains the same in both trends.
Symmetric Triangle Pattern
In the image, you can observe that the blue lines represent the rising and falling trendlines forming the bullish symmetric triangle pattern. The black line represents the behavior of price, which consolidates in a symmetric triangle pattern. The price target is taken as the height of the symmetric triangle pattern, as shown by the red vertical line.
The stop loss for the symmetric triangle pattern is placed right below the breakout point.
Bullish and Bearish Flag Patterns
A flag pattern is a price consolidation before the trend continues.
A bullish flag pattern is a consolidation of price between two parallel downward-sloping trendlines. The whole formation appears like a flag. The breakout from this pattern shows that the trend is continuing, and buyers have regained control.
Bullish Flag Pattern
As you can see in the chart above, the bullish flag pattern is represented by a set of parallel blue lines. The price consolidates between these lines before breakout.
The price target for a bullish flag is equivalent to the height of the trend prior to the formation of the pattern (red vertical line), and the stop loss is usually kept right below the breakout point.
The bearish flag pattern is the opposite of the bullish flag. It forms between a set of two parallel rising trendlines, and it appears in the downtrend and has the same criteria for stop loss and profit targets as a bullish flag pattern.
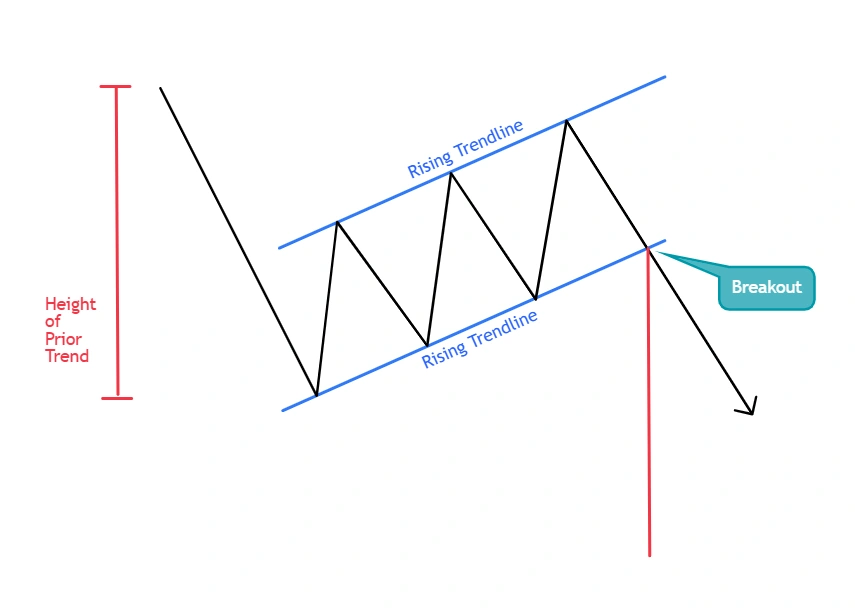
Bearish Flag Pattern
Rising and Falling Wedge Pattern
The rising and falling wedge patterns are continuation patterns that are similar to the flag patterns, but instead of forming between a set of parallel lines like in the flag pattern, the wedge patterns form between a set of trendlines that are converging towards each other.
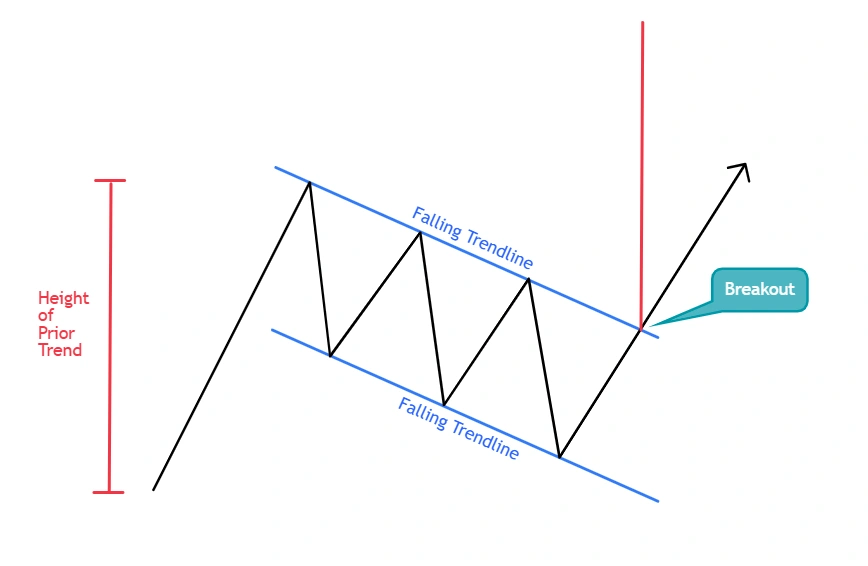
A falling wedge is a bullish pattern and forms in the middle of the uptrend. This pattern has similar profit target and stop loss criteria similar to the bullish flag pattern.
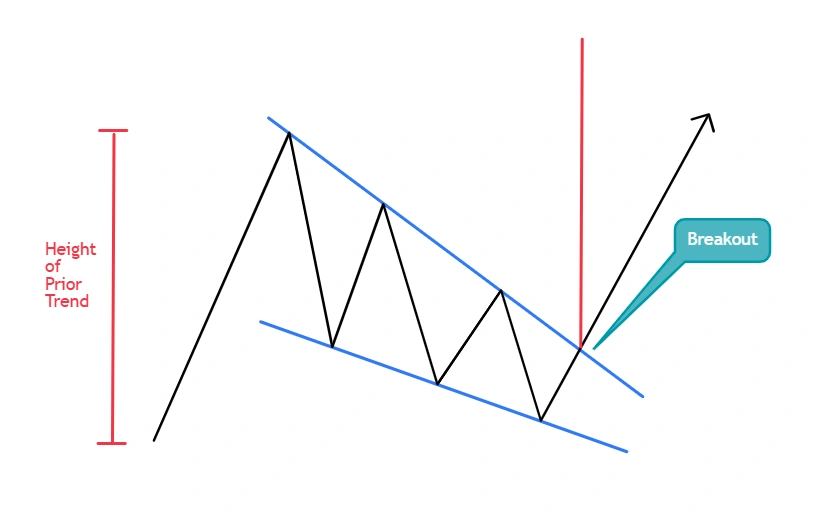
Falling Wedge Pattern
The price target for this pattern is equivalent to the height of the prior trend. The formation of this pattern indicates a temporary halt in buying. A breakout indicates a continuation of the uptrend.
The rising wedge pattern is a temporary pause in the downtrend. It is a bearish pattern, and its breakout shows a continuation of the downward trend.
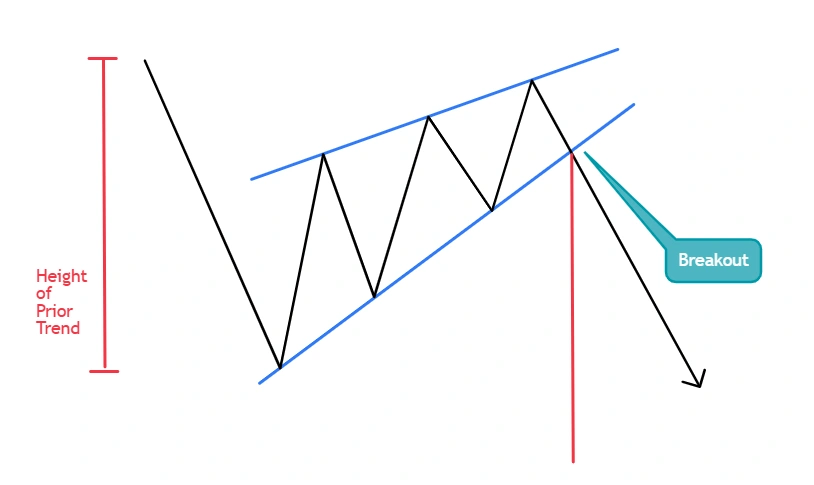
Rising Wedge Pattern
Key Considerations
Here are some key considerations before using continuation patterns.
- While spotting and trading with continuation patterns, always wait for a breakout and use confirmation signals like volume or momentum to confirm the breakout. This increases the reliability of the pattern.
- One key aspect of these patterns is that they do not predict the future direction of the market with a 100% guarantee. These patterns are just the probability of the most likely scenario.
- Always remember that continuation chart patterns fail. After a breakout, these patterns can move in the opposite direction. Always use stop losses to avoid significant losses in these situations.
- These patterns can appear on all timeframes, but the higher the timeframe these patterns are forming, the higher the probability of their success.
- There are no hard and fast rules for stops and profit targets. The rules for stops and profit targets discussed above can be tweaked as per a trader’s risk-taking capability.
Conclusion
Identifying continuation patterns in stocks takes a long time. Beginners must try to observe these patterns on a number of different stock charts. Trading technical analysis continuation patterns can be risky, and proper risk management should be used.
DISCLAIMER: This article is not meant to be giving financial advice. Please seek a registered financial advisor for any investments.

- Weekly Nifty 50 Trading Strategies and Technical Outlook - June 11, 2025
- Nifty 50 Trading Strategies and Technical Analysis - May 26, 2025
- Weekly Nifty 50 Technical Analysis: Key Trading Strategies - April 30, 2025