Table of Contents
Want to catch trend reversals early? Explore key reversal chart patterns that signal potential market shifts. Learn how to spot trend exhaustion through this blog.
Chart pattern formations are commonly used among traders to understand the current and possibly the future direction of stock markets. In technical analysis, two types of chart patterns are commonly used – Continuation and reversal patterns. This blog provides insights into what reversal chart patterns are and how to identify these patterns.
Reversal Chart Patterns
Reversal chart pattern formations are a signal that the current trend has a high probability of reversing. These patterns can be an early signal of exhaustion of an uptrend or a downtrend. These patterns are formed when buying or selling pressure fades and opposite forces take hold of the market.
Identifying reversal patterns in trading can give traders an early advantage over other market participants. When these patterns appear after an uptrend they bring profit taking opportunities or short selling opportunities. These patterns can signal buying opportunities when they emerge after a downtrend.
Let us look at some of the key reversal chart patterns.
Heads and Shoulders Pattern
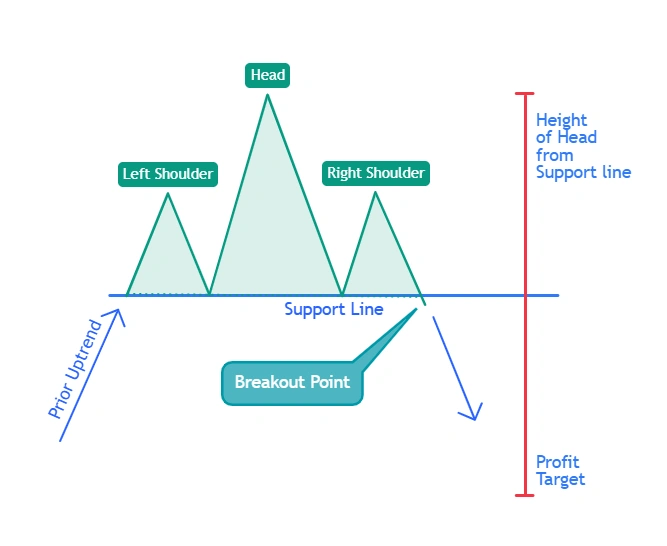
This pattern is the most discussed pattern in Technical Analysis. The formation of heads and shoulders pattern appears like a head surrounded by two shoulders.
The completion of these patterns at the end of the uptrend is considered a bearish reversal pattern and indicates that buyers have given up and sellers have gained control. This can signal the start of a potential downtrend.
Heads and Shoulders Pattern
Key aspects of a heads and shoulders pattern are:
- The height of the left and right shoulder are almost the same, some variation can be there but a major variation should not be there. The head will always be higher than the two shoulders.
- A high volume at breakout is a good confirmation of the pattern and increases the probability of its success.
- The profit target of the heads and shoulders pattern is similar to the height of the head from the support line. The stop loss is placed at right above the breakout point.
- The support line does not have to be a horizontal line. It can be slightly tilted in either direction.
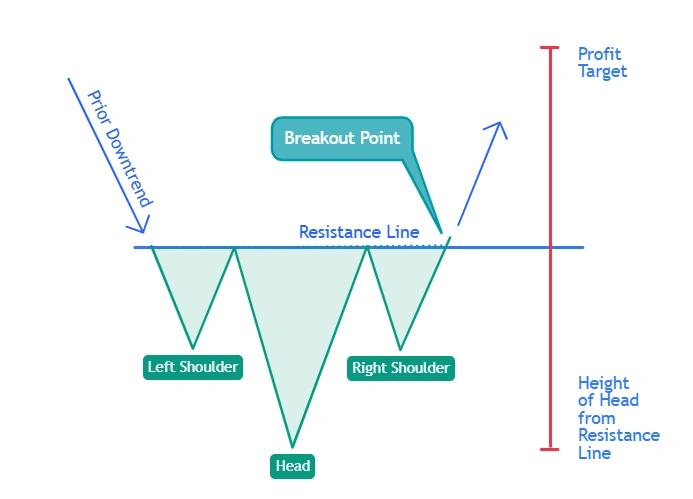
When this pattern appears after a downtrend it is called a Reverse Heads and shoulders pattern and it is a bullish reversal pattern that can signal an end of a downtrend. This pattern can suggest that buying pressure is increasing and sellers are losing control of the market.
Reverse Heads and Shoulders Pattern
The profit target and stop loss criteria and other aspects of the reverse heads and shoulders pattern are similar to the heads and shoulders pattern.
Double Top and Double Bottom
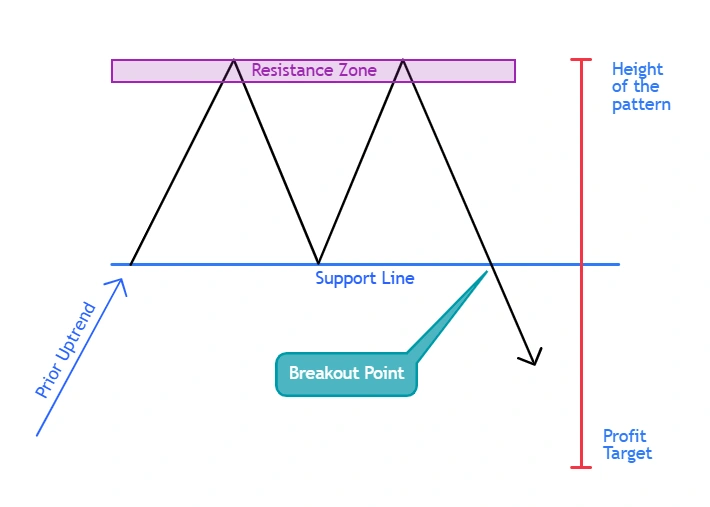
The double-top pattern is a widely used bearish reversal pattern. The double top pattern shows the buyers are unable to take the price beyond a certain resistance level. It signifies that the uptrend might have been exhausted and can reverse.
Double Top Pattern
Key aspects of a double-top pattern are:
- The height of the two tops must be almost equal in height from the support line, a slight variation can be ignored.
- The pattern is confirmed when the price breaks below the support line and if this breakout is supported by heavy volume or any other technical indicators, the confirmation becomes better and probability of success is improved.
- The profit target after the breakout is equal to the height of the pattern from the support line, and the stop loss is placed right above the breakout point.
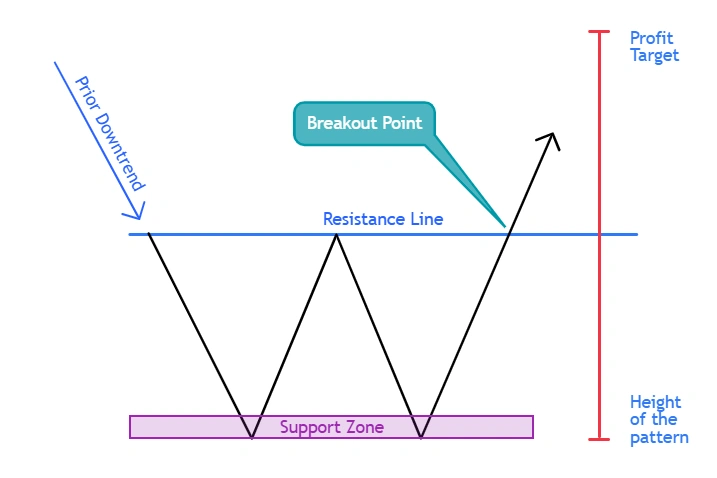
The double bottom pattern is a bullish reversal pattern that signals that a downtrend might be coming to an end. This signals that the selling pressure is fading since buyers are absorbing the supply.
Double Bottom Pattern
The profit target and stop loss criteria and other key aspects of the double bottom pattern are similar to the double top pattern.
Triple Top and Triple Bottom
The triple-top pattern shares many similarities with the double-top pattern. Instead of two price peaks this pattern has three price peaks. Triple tops pattern is a bearish reversal pattern and its appearance indicates an exhaustion of an uptrend.
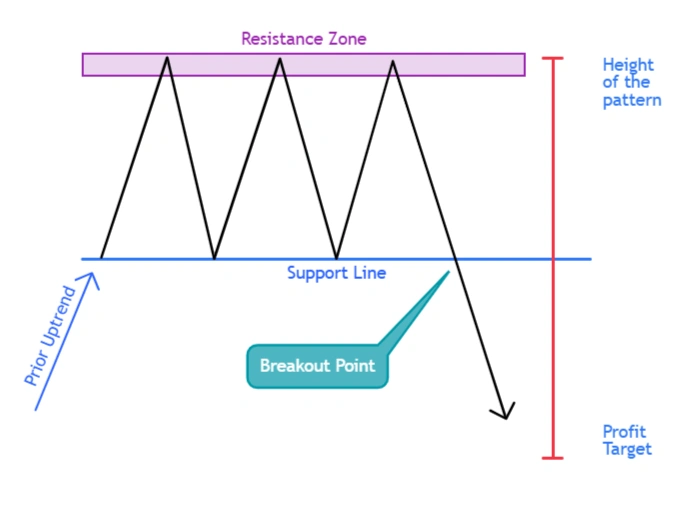
Triple Tops Pattern
Key aspects of triple-top patterns are:
- The height of the three tops must be almost equal in height from the support line, a slight variation can be ignored.
- The pattern is confirmed when the price breaks below the support line and if this breakout is supported by heavy volume or any other technical indicators, the confirmation becomes better and probability of success is improved.
- The profit target after the breakout is equal to the height of the pattern from the support line, and stop loss is placed right above the breakout point.
- The support line does not have to be perfectly horizontal, a slight tilt in either direction might be observed.
The triple bottom pattern is a bullish reversal pattern that signals that the downtrend is fading and selling pressure is weakening.
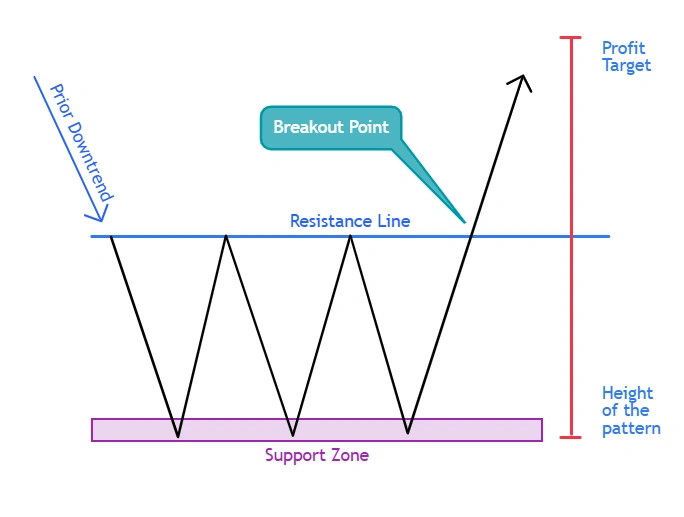
Triple Bottom Pattern
The profit target and stop loss criteria and other key aspects of the triple bottom pattern are similar to the triple top pattern.
Key considerations
Here are some of the key considerations before employing technical analysis of reversal patterns:
- Any patterns in technical analysis must be used to stop losses. The same is true for the reversal chart patterns. These methods can be risky, and proper risk management is required to trade these patterns.
- Reversal chart patterns do not guarantee a move after a breakout. These patterns only give a probability of what is most likely to happen.
- Traders must have patience. These patterns must only be acted upon when these are complete and a breakout is confirmed with either high volume or any other technical indicator.
- These patterns are more reliable when spotted on bigger time frames like daily or weekly charts.
Conclusion
Identifying reversal patterns in trading takes a lot of time to master. Beginners must look at many charts and try to sport these patterns. Always remember that these patterns can fail too. But technical analysis of reversal patterns provides a picture of how the forces of buying and selling are behaving in the market therefore giving the overall picture of the markets.
DISCLAIMER: This article is not meant to be giving financial advice. Please seek a registered financial advisor for any investments.

- Weekly Nifty 50 Trading Strategies and Technical Outlook - June 11, 2025
- Nifty 50 Trading Strategies and Technical Analysis - May 26, 2025
- Weekly Nifty 50 Technical Analysis: Key Trading Strategies - April 30, 2025