Table of Contents
Discover the difference between candlestick patterns vs chart patterns, their significance, and the key differences
In technical analysis, price patterns play a key role in gauging the mood of the stock markets. There are two types of technical analysis patterns – charts and candlesticks. Both these patterns serve different purposes for different traders. For beginner traders, it is important to understand what differentiates these patterns from each other. This blog will highlight the major differences between candlestick patterns vs chart patterns.
What are Candlestick Patterns?
Candlesticks offer a visual representation of the price for a given time period. It provides the data for open, close, low, and high prices for that time period. The colour of candlesticks provides insights into whether the candle is a bullish (open < close) or a bearish (open > close) candle.
The sequence of appearance of candlesticks gives a clear visual representation of the immediate or short-term mood of markets. Traders use candlesticks pattern analysis to identify a set of patterns that can be used to find out if the price move can continue or if it might reverse. These patterns are called candlestick patterns.
For example, on the daily chart of HDFC Bank (as of 17 Feb 2025), you can see the formation of a bearish engulfing pattern (marked by blue arrows), this pattern can suggest exhaustion of an uptrend. Notice that this candlestick pattern is formed using just two candles.
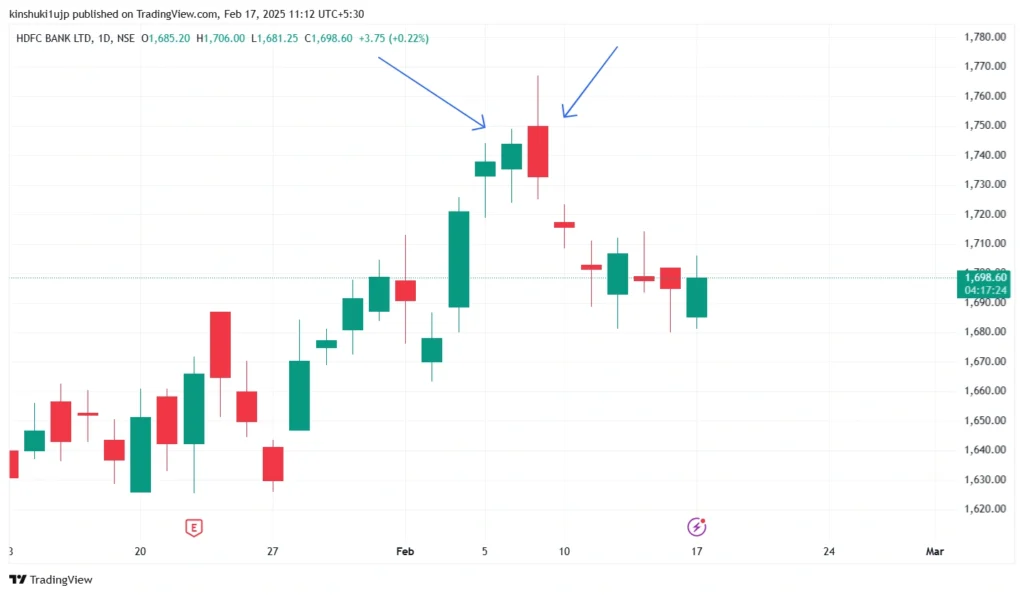
Source: Tradingview; HDFC Bank daily chart (Not an investment advise)
Candlesticks patterns can be broadly classified as:
1.Single Candlestick Patterns: Single candlestick patterns are formed using only one candle. These are usually formed after a trend and can indicate exhaustion or continuation of the trend.
If these patterns are formed after an uptrend, they are considered bearish, and if formed after a downtrend, these are called bullish candlestick patterns.
For example, Doji, Hammer, Shooting Star, Inverted Hammer, etc. are some common reversal patterns, and Marubozu candles can suggest a continuation of the trend.
2.Multiple Candlestick Patterns: These candlestick patterns are formed using two or more candles. The appearance of these candles can indicate the continuation or reversal of a trend.
For example, Engulfing, Morning Star, Evening Star, etc, are examples of reversal patterns, and three black crows and three white soldiers are examples of continuation patterns.
Traders must note that the continuation patterns can appear in both uptrends and downtrends, and their appearance signifies the trend can continue.
What are Chart Patterns?
The price movement of a stock or an asset over time can form chart patterns. Chart pattern identification can be done using any type of price chart, like a candlestick chart, line chart, etc. These patterns can take from weeks to months to form.
The chart patterns that appear on higher timeframes are more reliable than those on smaller timeframes. The appearance of chart patterns can signal a potential trend reversal or a trend continuation. These patterns also need confirmation using volume or other indicators to increase their reliability.
For example, you can see the formation of falling wedge patterns on the chart of Nifty 50 Index (as of 17 Feb 2025), as you can notice this pattern is being formed using multiple candlesticks over a time period of 6 months.
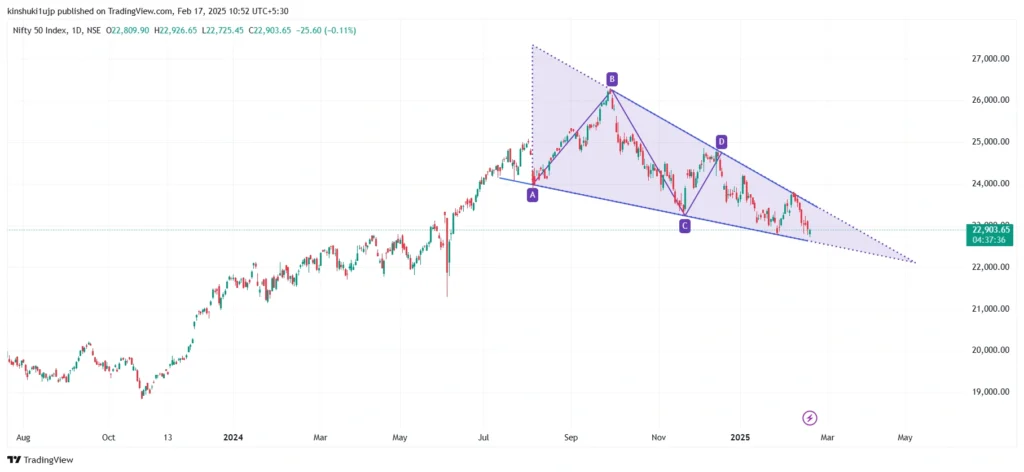
Source: Tradingview; Nifty 50 Index daily chart (Not an investment advise)
There are two major types of chart patterns:
1.Continuation Pattern: The appearance of these patterns on price charts indicates a high possibility of continuation of the prevailing trend.
A continuation pattern is a sideways consolidation or a move (usually temporary) against the ongoing trend. The formation of continuation patterns suggests that buyers are waiting for further cues for trend continuation. These patterns often have low volumes during their formation, indicating indecision, and high volumes during breakouts.
For example, Cup and Handle, Triangles, Falling / Rising wedges, etc, are some commonly used continuation patterns.
2.Reversal Patterns: These patterns suggest a possible end of the current ongoing trend and a possible reversal.
These patterns give an indication that the buyers are unwilling to buy anymore, and either they are taking profits, or there are short sellers at these levels. This indicates a high probability of trend reversal.
For example, some of the commonly used reversal patterns are head and shoulders, double top, double bottom, triple top, etc.
Candlestick Patterns vs Chart Patterns
Here are the key differences between candlesticks and chart patterns:
| Criteria | Candlestick Patterns | Chart Patterns |
| Purpose | Identifies short term moves in the markets | Identifies the broader price movement and trend |
| Timeframe | Forms over short term | Forms over medium to long term |
| Structure | For using one to three candles | A collection of candlesticks and forms using multiple candles |
| Use | Suitable for intraday and short term trading | Suitable for swing or positional trading |
| Complexity | Easy to interpret for quick decision making | Needs confirmation and more rigorous analysis |
| Example | Doji, shooting star etc. | Heads and Shoulders, Double top, etc |
Key Considerations Before Using Patterns
A trader using price patterns, whether candlesticks or chart patterns, must consider these factors:
- Price patterns do not guarantee a confirmed price move. These patterns only give a probability or chance of what is likely to happen next.
- Price patterns must always be confirmed with other indicators like volume or any other technical indicators.
- Technical Analysis patterns trading is risky. So, trading chart patterns or candlestick patterns must be made with strict stop loss and proper risk management.
Conclusion
Understanding the difference between candlestick patterns vs chart patterns is an essential first step toward mastering technical analysis patterns. Chart and candlestick pattern analysis are widely used methods for short-term and positional trading. Price patterns provide a very efficient way to study the mood of the markets. Chart pattern identification takes a lot of practice to master.
DISCLAIMER: This article is not meant to be giving financial advice. Please seek a registered financial advisor for any investments.

- Weekly Nifty 50 Trading Strategies and Technical Outlook - June 11, 2025
- Nifty 50 Trading Strategies and Technical Analysis - May 26, 2025
- Weekly Nifty 50 Technical Analysis: Key Trading Strategies - April 30, 2025