Too many investors still rely on instincts or market rumors, only to end up buying high and selling low. The real problem? They’re flying blind. Without a clear view of market patterns, predicting price movements becomes impossible. This is where technical analysis reports come handy. These data-backed tools break down charts, trends, and volume shifts to help you make smarter, more strategic moves.
In fact, the numbers speak for themselves; a recent SEBI study found that 97% of the profits earned by foreign funds in FY24 came from algo-trading, which thrives on technical indicators. It’s time every investor stopped guessing and started analyzing. Let’s discuss why these reports are no longer optional, they’re essential.
What are Technical Analysis Reports?
Technical analysis reports help investors understand how a stock or asset might move in the future by looking at its past price and trading volume. Instead of focusing on company details or financials, these reports look at price charts and trading patterns to find signals for when to buy or sell.
A typical report leverages various methods, including the study of chart patterns (like support and resistance, Head and Shoulders, or Double Tops/Bottoms) and the application of technical indicators and oscillators (such as Moving Averages, MACD, and RSI).
These reports aim to highlight patterns, trends, and key price levels, making it easier to spot the right time to enter or exit a trade.
In the next sections, we have some of the most common technical indicators explained which are used in these reports and learn how they work.
Main Tools and Patterns Used in Reports
Technical analysis mainly relies on two things: chart analysis reports and technical indicators. These tools help investors make sense of price movements, spot trends early, and find possible entry or exit points based on market behavior.
Chart Patterns and Price Signals
Chart patterns are shapes formed by price movements. They show how buyers and sellers behave at different price levels.
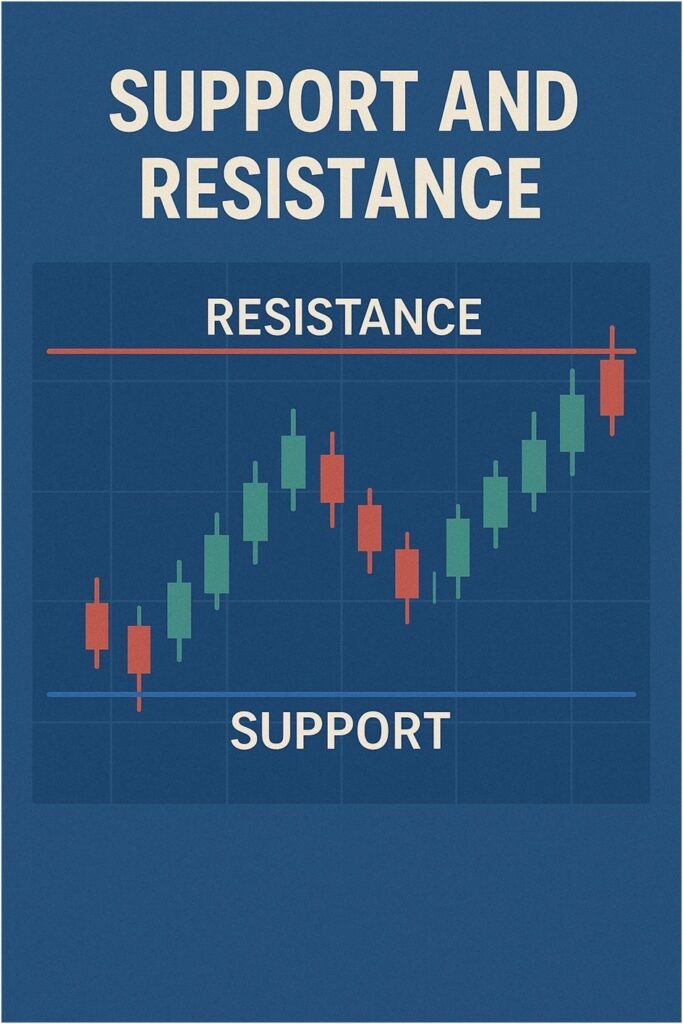
- Support and Resistance: Support is a level where prices usually stop falling. Resistance is where prices tend to stop rising. These levels help spot potential reversals or breakouts.

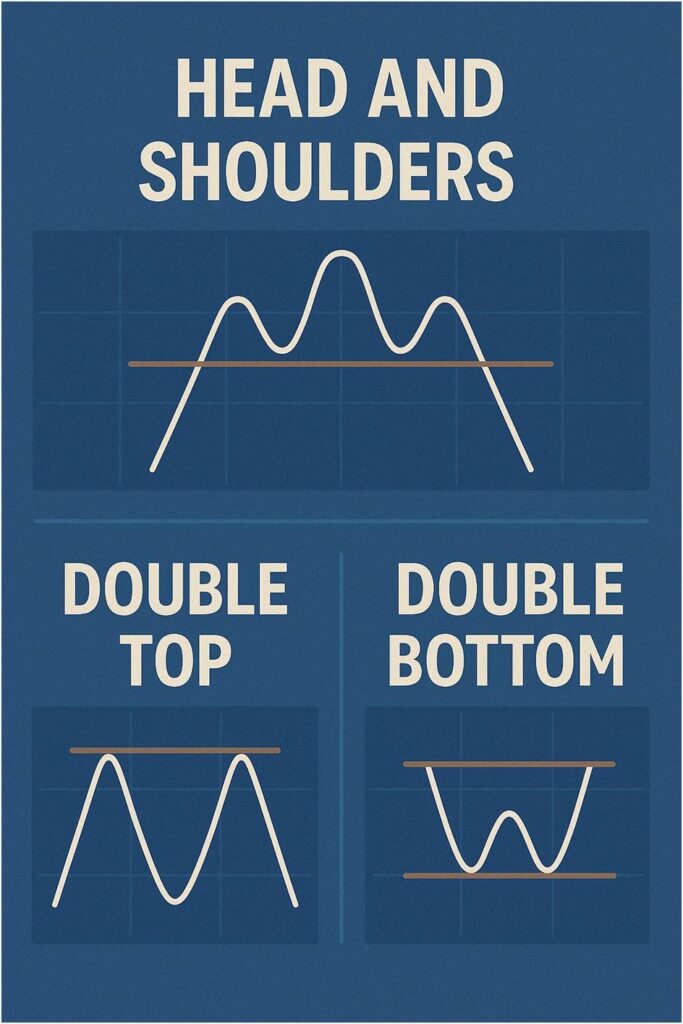
- Reversal Patterns: Head and shoulders demonstrate clear signs that an upward trend may reverse. Whereas double top/bottom represents a double top signals a likely fall; a double bottom may suggest a rise.

- Gap Theory: Gaps appear when there’s a sharp difference between a day’s closing and the next day’s opening price. These gaps often show strong market sentiment and may act as future support or resistance.
Technical Indicators
Indicators use formulas based on price and volume to confirm patterns and trends.
- Moving Averages (MAs): These smooth out price changes over time. Crossovers between price and the moving average can signal entry or exit points.
- MACD (Moving Average Convergence Divergence): Tracks the difference between two moving averages. It helps show momentum and possible changes in trend direction.
- RSI (Relative Strength Index): Measures the strength of price moves.
- Above 70 suggests overbought conditions (price may fall).
- Below 30 suggests oversold conditions (price may rise).
- Bollinger Bands: Three lines show price volatility. When the bands tighten, a breakout might follow. Prices touching the upper or lower band may signal a change.
Must-Know Benefits of Technical Analysis Reports

Technical analysis reports are powerful tools for investors and traders. They help you understand how prices move, what patterns are forming, and what that might mean for the future. Instead of relying on news or opinions, these reports focus on price charts, trading volume, and simple indicators that tell you what’s really happening in the market.
Let’s look at some key benefits of using technical analysis reports.
- Finding the Right Time to Buy or Sell
Timing can make the difference between profit and loss. These reports highlight patterns and signals that suggest when a price may rise or fall. For example:
- A strong support level may be a good time to buy.
- A reversal pattern like Head and Shoulders may suggest it’s time to sell.
This helps you make decisions based on data, not guesswork, so you can improve your timing and “ reduce risk.
- Understanding How the Market Reacts
Markets often move quickly in response to news events, earnings releases, economic reports, or unexpected global developments. Technical analysis reports focus on how prices behave around these events rather than the reasons behind them. A sudden jump in price accompanied by heavy trading volume reveals strong interest and conviction among market participants.
On the other hand, muted price action despite major headlines can expose a lack of enthusiasm. Having this real‑time feedback allows investors to adapt their strategies promptly, rather than waiting for fundamental reports or expert commentary.
- Spotting Volatility and Volume Trends
Price changes and trading activity can tell you a lot about the strength or weakness of a trend.
- Volatility measures how much a price moves. Higher volatility can mean bigger gains but also bigger risks.
- Volume tells you how many people are trading. A price move with high volume is more reliable than one with low volume.
Reports often include tools like Bollinger Bands to show volatility or volume charts to show trading interest. This helps you spot opportunities and manage risk more effectively.
- Comparing Strength Between Stocks
Not all securities move together, and some stand out by holding value better or rallying more strongly than others. Technical analysis reports offer tools to compare performance, highlighting which stocks or assets are outperforming their peers.
An investment that shows steadier gains during market dips or sharper rises during rallies demonstrates what traders call relative strength. By focusing on these stronger performers, investors can allocate capital more effectively, riding established trends rather than chasing uncertain prospects.
- Works Across All Markets and Timeframes
Technical analysis applies universal principles that work in stocks, commodities, currencies, and even cryptocurrencies. Likewise, it adapts to any trading style or horizon. A day trader might rely on five‑minute charts and rapid‑fire indicators, while a long‑term investor examines weekly or monthly trends to guide decisions.
This flexibility means that regardless of the market you choose or the time frame you prefer, technical analysis reports can be tailored to deliver relevant insights.
- Reduces Emotional and Impulsive Decisions
Emotions like fear and greed often lead to poor trading choices, buying on hype or selling in panic. Technical analysis reports provide clear, data‑based rules for when to enter trades, where to place protective stops, and when to exit. By following this structured approach, investors can avoid reacting impulsively to market noise. The result is a more disciplined strategy that relies on what the charts show rather than on gut feelings or unverified opinions
Conclusion
Relying on instincts in the market can be risky. Technical analysis reports bring clarity by turning past price data into actionable insights. They help you time trades better and reduce emotional decisions. To make the most of these insights, consider consulting a trading expert for tailored guidance.
- Make in India 2.0: How Manufacturing Is Reshaping Market Sentiment - December 13, 2025
- Real Estate Boom : Why Tier-2 Cities Are Attracting Big Investors - December 12, 2025
- India’s GDP Surge 2025: What the New Growth Numbers Mean for Markets - December 9, 2025


