As of February 2025, the Indian stock market is in a very confusing state for traders and investors. The market participants have mixed views, with some predicting a swift recovery for markets from the current lows and some predicting an upcoming market crash.
This article provides a Nifty 50 forecast using technical analysis as of 19th February 2025.
Nifty 50: Technical Analysis
Let us first understand what has happened in the Nifty 50 index in terms of price action in the last year using Technical Analysis.
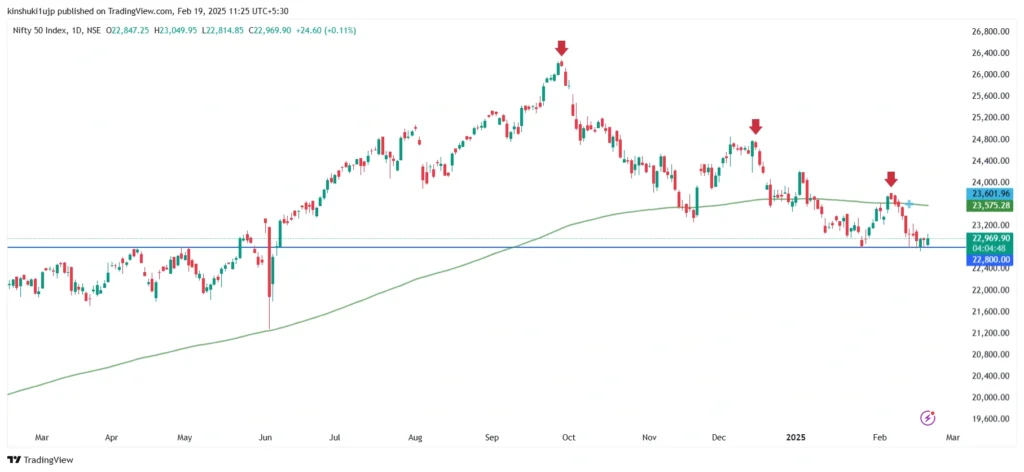
Source: Tradingview, Nifty 50 Index (Daily), 19th February, 2025
You can see the Daily chart of the Nifty 50 index, showing price data for the past year. These are the key price action and technical analysis highlights from this chart:
- Since September 2024, the Nifty 50 index has been making a series of lower highs (marked by red arrows) and lower lows, indicating a downtrend formation. This is a bearish sign.
- The index closed at a 22,945 level on 18th February 2025, a 12.68% drop from its all-time high of 26,277 reached on 27th September 2024.
- The index is also trading below its 200-EMA (green line), another bearish sign for the index.
- However, the index has not fallen below its long-standing support level of 22,800 (horizontal blue line) despite multiple attempts by sellers. This is a good sign for the index, indicating the presence of buyers at these levels.
This clearly shows that Nifty 50 has faced some downside pressure recently.
Nifty 50 Forecast
Now, we will look at the nifty 50 forecast using important technical signals that traders should watch out for to confirm a bullish or a bearish move.
Bullish Outlook
Investors can watch out for these technical price action signals to confirm a bullish outlook for the Nifty 50 index.
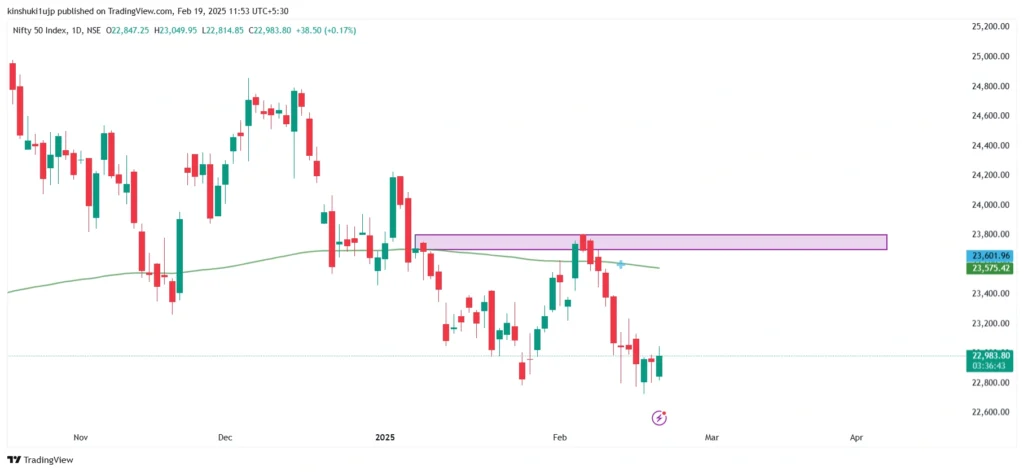
Source: Tradingview, Nifty 50 Index (Daily), 19th February, 2025
- The Nifty index can be considered bullish if it crosses above its immediate resistance level of 23,700 – 23,800 (purple zone). If the index crosses this zone, it will be a bullish signal.
- Crossing the resistance zone of 23,700 – 23,800 would also mean that the price would have moved above its 200-EMA (green line), which would be another bullish sign.
Traders can use technical indicators like the Moving Average Convergence and Divergence (MACD) to confirm this move.
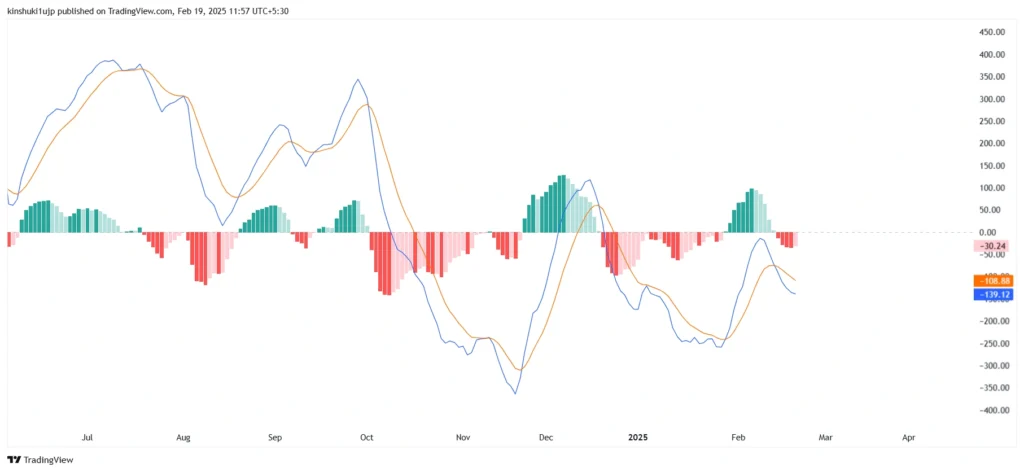
Source: Tradingview, Nifty 50 MACD (Daily), 19th February, 2025
If this price move is supported by the MACD or any other technical indicator crossing above its zero line, it will indicate the presence of momentum that can act as confirmation for this move.
Now, let us take a look at what technical signals will confirm a further bearish move for the Nifty 50 index.
Bearish Outlook
Traders can watch for these technical signals to confirm a bearish move in the Nifty 50 index.
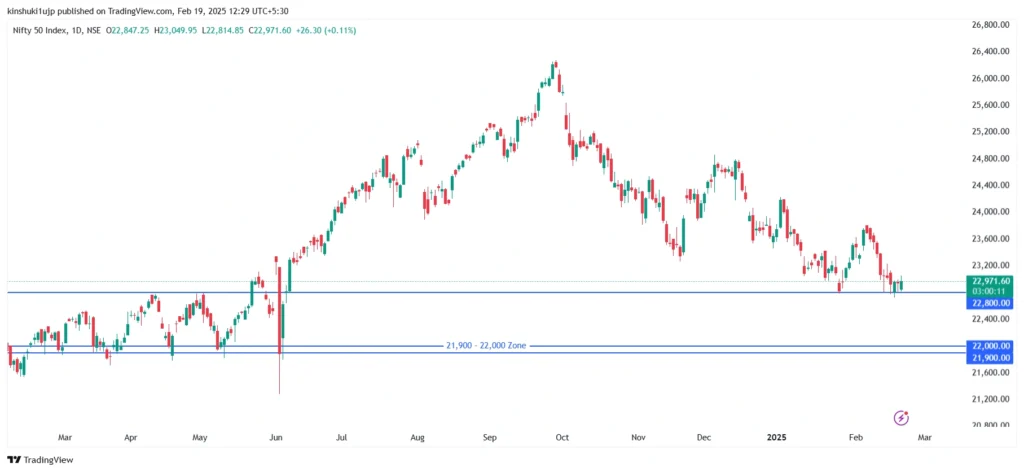
Source: Tradingview, Nifty 50 Index (Daily), 19th February, 2025
- The Nifty 50 index is already in bearish territory, but the index has strongly held its support level of 22,800.
- If the index falls below this support level, the next support zone, based on previous price action, turns out to be the 21,900 – 22,000 zone. Meaning that a breach of 22,800 levels will increase the chances of the index moving towards the 21,900 – 22,000 zone.
Since the Nifty 50 index does not get traded, it does not have volume data, but it has future contracts. Traders can also use the open interest data to confirm these moves. A rising open interest (with a bullish or a bearish move) can be used as a confirmation for the move.
Nifty MidCap 150 Index
The price action of the Nifty Midcap 150 index has been somewhat similar to the Nifty 50 index. Let us take a look at the price action analysis for this index.
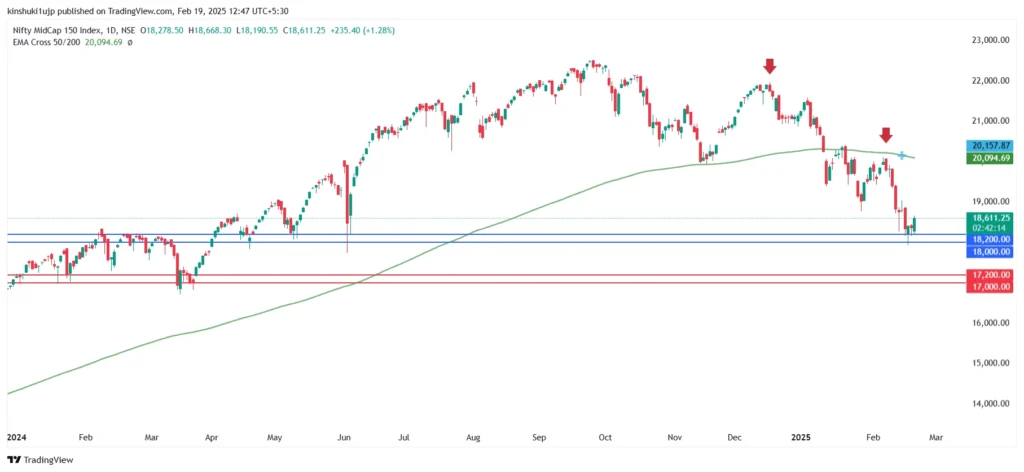
Source: Tradingview, Nifty Midcap 150 Index (Daily), 19th February, 2025
Key technical highlights for the Nifty Midcap 150 index are:
- The nifty midcap 150 index is trading at the 18,600 level as of 19th February 2025, which is a correction of 17.38% from its all-time high value of 22,515, reached on 25th September 2024.
- The index has been making a series of lower highs and lower lows since then (marked by red arrows), indicating a downward market trend. This is a bearish sign.
- The index is also trading below its 200-day EMA (green line), which also indicates some bearishness.
- The index has very recently bounced back off its major support zone of 18,000 – 18,200 (blue lines), which indicates the presence of buyers at these levels.
- Traders must carefully watch out for the 18,000 – 18,200 zone. If the index moves below this zone, then there will be a very high probability of the index moving towards its next support zone of 17,000 – 17,200 (red lines), which can be very bearish for the midcap index and midcap stocks.
- If the index moves past its 200-day EMA, it can be very bullish for the index, and there will be a very high probability of the Midcap index continuing its upward market trend. But since it might take a lot of time and a lost opportunity for traders, traders can watch the 1-hour chart for the Nifty Midcap 150 index for bullish signals.
- If the index moves past its 200 EMA on the 1 hour (or 60 minutes chart) represented by the green line, it can be considered a bullish signal for the index in the short term, meaning it can be a sign of bullish strength returning to the index.
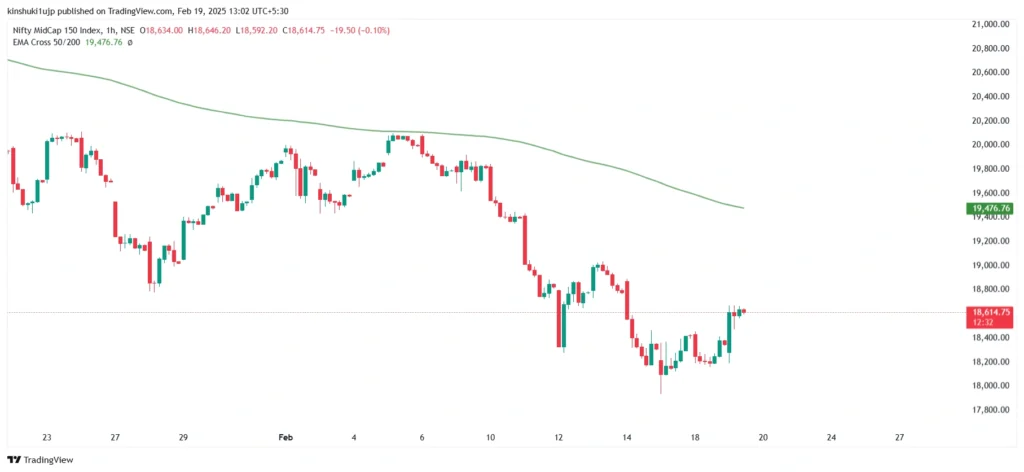
Source: Tradingview, Nifty 50 Index (1 hour), 19th February, 2025
Nifty SmallCap 250 Index
Now, let us move further in our stock market analysis and look at the price action of the Nifty SmallCap 250 index to understand the state of SmallCap stocks.
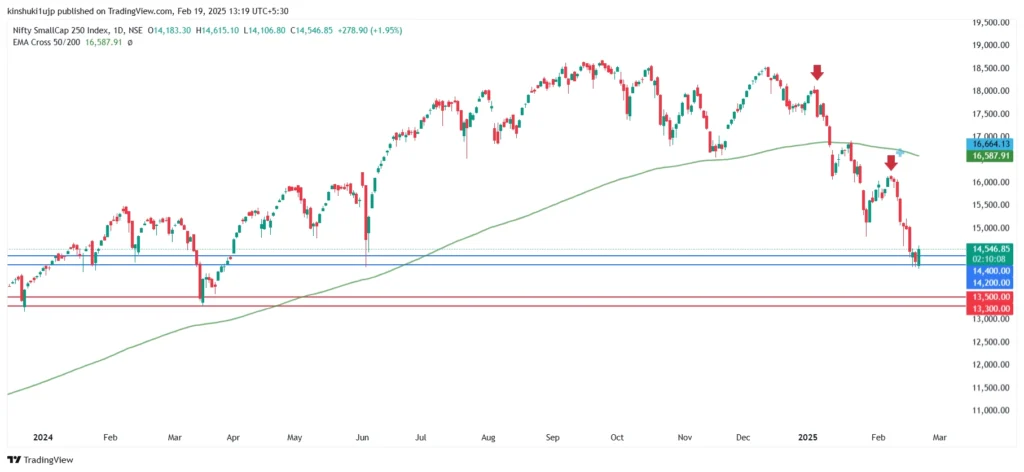
Source: Tradingview, Nifty Smallcap 250 Index (Daily), 19th February, 2025
Key technical highlights for the Nifty Smallcap 250 index are:
- The nifty smallcap 250 index is trading at the 14,530 level as of 19th February 2025, which is a correction of 22.24% from its all-time high value of 18,688, reached on 24th September 2024.
- The index has been making a series of lower highs and lower lows (marked by red arrows), indicating a downward market trend, which is a bearish sign.
- The index is also trading below its 200-day EMA (green line), which also indicates some bearishness.
- The index has very recently bounced back off its major support zone of 14,200 – 14,400 (blue lines), which indicates the presence of buyers at these levels.
- Traders must carefully watch out for the 14,200 – 14,400 zone. If the index moves below this zone, then there will be a very high probability of the index moving towards its next support zone of 13,300 – 13,500 (red lines), which can be very bearish for the smallcap index and smallcap stocks.
- If the index moves past its 200-day EMA, it can be very bullish for the index, and there will be a very high probability of the smallcap index continuing its upward market trend.
Conclusion
Here it is, the nifty midcap 150, nifty small cap 250 index, and nifty 50 forecast using price action analysis. This analysis gives us a picture of the mood of the entire Indian stock market, which has been bearish recently. Traders can use additional technical indicators to gauge the market mood. Always remember these tools never give 100% accurate predictions for the market. They just provide insights into the most likely outcomes for stock market analysis.
DISCLAIMER: This article is not meant to be giving financial advice. Please seek a registered financial advisor for any investments.

- Weekly Nifty 50 Trading Strategies and Technical Outlook - June 11, 2025
- Nifty 50 Trading Strategies and Technical Analysis - May 26, 2025
- Weekly Nifty 50 Technical Analysis: Key Trading Strategies - April 30, 2025