Weekly Nifty 50 Technical Analysis: From technical analysis to trading strategies, get a complete view of Nifty 50 chart patterns and support/resistance levels.
The current week, ranging from 7th – 11th April 2025 can be a volatile one for the Indian stock markets as the RBI will present its interest rate decision on 9th April 2025. Thursday, April 10, 2025, Indian markets will remain closed due to Mahavir Jayanti. The weekly Nifty 50 Technical Analysis blog will cover the price action analysis and key events that can influence the Indian stock market trends this week.
Market Recap: 31st March – 4th April, 2025
In the previous week (31st March – 4th April 2025), the Nifty 50 index closed 2.61% lower at 22,904 level. In the same period, the Nifty IT index was the worst performer, which lost 9.15% in a single week, whereas the Nifty FMCG Index was the best performer by gaining 0.45% for the week.
In the same time period, the other major Indian indices performed as follows:
| Index | % Gain/Loss (31st March – 4th April) |
| Nifty Mid-Cap 150 | -2.33% |
| Nifty Small-Cap 250 | -2.14% |
| Nifty Next 50 | -2.50% |
| Nifty 500 | -2.50% |
| Sensex | -2.65% |
Reasons for Poor Market Performance
Let us look at the reasons why market performed poorly last week:
- FII/DII Activity: In the cash segment the foreign institutional investors were net sellers (Total Buying – Total Selling) of equities in the cash segment. Although domestic institutional investors were net buyers, the extent of FII selling was much higher than DII buying.
| Date | FII (₹ crores) | DII (₹ Crores) |
| March 31 | Holiday | Holiday |
| April 1 | -5,901 | 4,322 |
| April 2 | -1,538 | 2,808 |
| April 3 | -2,806 | 221 |
| April 4 | -3,483 | -1,720 |
| Total | -13,728 | 5,631 |
Source: Stockedge
2. US Government Tariffs: The US government imposed 26% tariffs on all imports from India. The reasons that these tariffs sparked selling in the markets might be that market participants were not expecting such high tariffs, and it came as a surprise.

China added fuel to the fire by imposing 34% tariffs on all imports from the US. These events are possibly increasing the investor’s concerns of a trade war and a possible recession, which can be seen in global selloffs worldwide.
Weekly Nifty 50 Technical Analysis
Let us take a look at the key price action that took place in the Nifty 50 index last week.

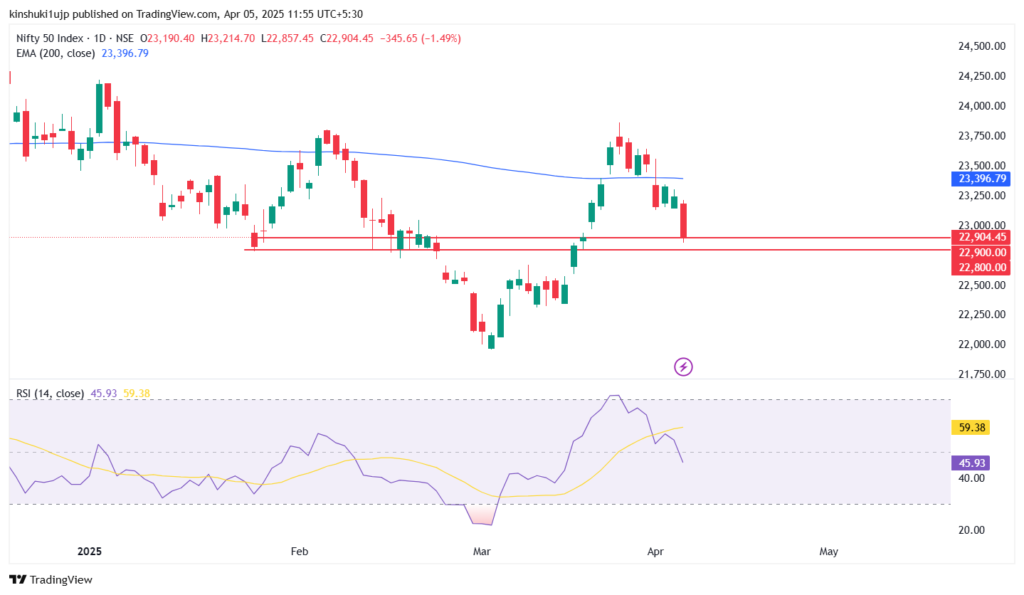
Source: Tradingview; Daily Chart of Nifty 50 Index with RSI Indicator and 200-day EMA (Data range: October 2024 – April 2025)
- After moving the 200-day EMA, the nifty 50 index again slipped below the 200-day EMA last week, which is a bearish sign for the index.
- The index was also trading at its immediate support level of 22,800 – 22,900 (marked by horizontal red lines).
But on Monday, April 7, 2025, the index opened 5% down, at 21,758 level.
- The RSI indicator on the daily chart also moved below the 50 level (mid-line), showing losing momentum.
There is no significant Nifty 50 chart pattern formation this week on any time frame charts.
Nifty 50 Trading Strategies: Key Levels to Watch
Let us look at some positive and negative signals and key Nifty 50 support and resistance levels that traders should watch out for:
Positive Signals
Source: Tradingview; Daily Chart of Nifty 50 Index with RSI Indicator and 200-day EMA (Data range: January 2025 – April 2025)
- The first positive sign of the Nifty 50 index is that it does not breach the 22,800 – 22,900 support and bounces back off this level.
- A more bullish signal from the index would be if the index crosses the 200-day EMA on the daily chart, which is around 23,400 level. This move can be confirmed by the RSI index again moving above the 50-line.
Since the 23,400 level is way distant from the current level of 22,900, traders can look at smaller timeframe charts (30-minute charts).
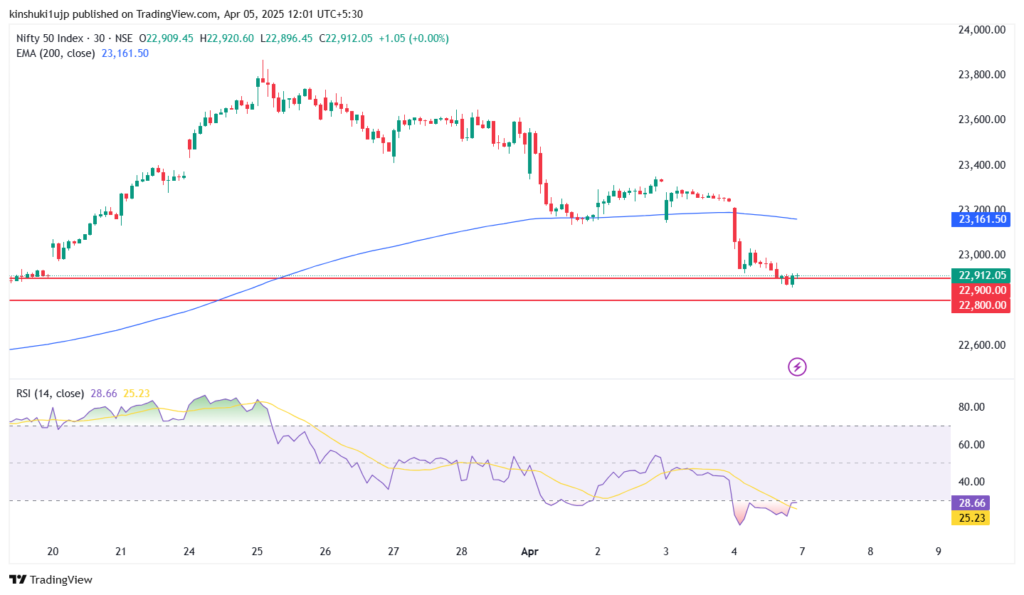
Source: Tradingview; 30-minute Chart of Nifty 50 Index with RSI Indicator and 200 EMA (Data range: March 2025 – April 2025)
- On a 30-minute chart, the Nifty 50 index needs to move past the 200 EMA (23,150 level) to show bullishness.
- This move can be confirmed by RSI (30-minute timeframe), which is already in oversold territory, moving above the 50-line.
Negative Signals

Source: Tradingview; Daily Chart of Nifty 50 Index with 200-day EMA (Data range: January 2025 – April 2025)
- The only negative sign for the index will be if it moves below its immediate support level of 22,800 – 22,900.
Since, on Monday’s open at 21,758 these levels are already breached, so the next support levels for the index will be 21,500- 21,600 if the selling continues.
Since the prevailing price action of the index is slightly negative, the index might have to show multiple positive signs to show strength, whereas a few negative signs might be enough to deteriorate trader sentiment.
Other Assets Performance
Let us look at how different asset classes and international markets performed in the previous week.
| Asset | % Gain/Loss (31st March – 4th April) |
| Gold Futures (MCX) | -0.82% |
| Crude Oil Futures (MCX) | -10.68% |
| India 10-Y G-Sec Yields | – 1.70% (11 basis points) |
| S&P 500 Index (USA) | -9.08% |
| FTSE 100 (UK) | -6,97% |
| Nikkei 225 (Japan) | -9% |
The reason for such massive down moves in the markets is the tariffs imposed by the US government, which sparked uncertainty among investors. The crude oil futures witnessed a sell-off since the tariffs sparked economic slowdown fears among investors.
Key Influences for The Upcoming Week
In the upcoming week (7th – 11th April 2025), the Indian stock market trends, along with the price action, will be impacted by the following factors:
- The RBI interest rate decision on April 9, 2025
- US Inflation rate data April 10, 2025.
- Other economic data, such as the Indian industrial production, inflation rate, bank loan growth, etc, will be presented on Friday evening.
Conclusion
The weekly nifty 50 technical analysis shows that the index saw selling pressure recently. At the same time, the index is at an important support level, a breach of which might trigger a further sell-off. Investors might also take some time to understand the impacts of the US government tariffs. The markets might stay volatile for a few weeks.
For better analysis, there are many online platforms worth exploring that provide in-depth charts, indicators, data and expert insights.

- Weekly Nifty 50 Trading Strategies and Technical Outlook - June 11, 2025
- Nifty 50 Trading Strategies and Technical Analysis - May 26, 2025
- Weekly Nifty 50 Technical Analysis: Key Trading Strategies - April 30, 2025