Table of Contents
Market fluctuations are governed by the demand-supply force, but what drives this force? It is the market sentiment. Explore this blog to understand its dynamics.
We often hear people asking – ‘What is the market sentiment today?’
The answer to this question is driven by different elements. These elements could be anything from cross-border tension rising defence stocks to Cristiano Ronaldo removing the Coca-Cola bottles from his camera frame.
An aggregate approach of investors towards the market is known as Market sentiment. Its analysis is important to understand the driving factors of market returns. Let us explore various dynamics of market sentiment, its analysis, and different indicators.
What is market sentiment?
Investors are the driving force of the market, and their emotions towards it have a significant impact. The herd psychology of investors is the core reason for markets to show the reactions in the prices. Such an approach of investors towards a particular stock, sector or whole market is known as market sentiment.
As the scope of the market increases, the number of factors deciding market sentiment also increases. There are different social, political, technological, and geological factors affecting the prices in the market. This cumulative effect shows the market sentiment.
Active investors, traders, high networth individuals (HNIs), etc, need to keep a keen eye on the movements in the market. These movements define the flow of the market, thus resulting in market sentiment.
There could be different types of market sentiments, such as:
- Positive or bullish
When the investors have an optimistic attitude towards the market, the sentiment is known to be positive. In such times, there are more buyers in the market, who move the stock prices on the higher side. It is known as bullish sentiment.
- Negative or bearish
When there is a pessimistic attitude towards the market, the sentiment is known to be negative. During this period, sellers overpower the market and pull the stock prices down. This is known as bearish sentiment.
- Neutral
Usually, when investors are not sure about the market and do not have any specific perception of whether it will rise or fall, there is a neutral market sentiment. The stock prices move within a certain range in the market.
How to analyse market sentiment?
- Financial statements and results
When a company or a country announces its financial results (position), in the form of annual results and economic surveys/budgets, the investors understand the overall condition and predict the future. For example:
Recently, when Marico Limited announced its improved financials in its FY25 Q1 results, on a similar day, its share was up by 6%. Investors are optimistic about the FY25 of a renowned brand like Marico.
- News
Information has the power to drive the market. Positive or negative information motivates investors’ emotions regarding the market, which results in market sentiment. For example:
A day before the general election 2024 results, on June 3, 2024, the market experienced a huge buying spree due to exit polls showing confidence in the ruling government. The market cap of BSE-listed companies hit a record high of 12.4 lakh crore.
- Indicators
There are different indicators showcasing market sentiment. Usually, investors check them before deciding to buy/sell in the market. They are an excellent way to analyse current, short-term market sentiment. Some of the important indicators are discussed in this blog.
Market sentiment indicators
- Volatility Index (VIX)
The market prices experience fluctuation, which are anticipated collectively in the volatility index (VIX). In India, this index indicates the fluctuations in market prices of NIFTY Index options for the upcoming 30 days . The higher the India VIX, the more volatility in the upcoming 30 days. Thus, investor’s mood becomes quite clear with this index.
- Market Mod Index (MMI)
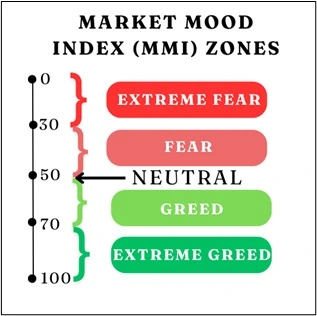
Only market extremes may not show the real market sentiment of investors. There is a need to consider the effect of different factors. It is the function of the Market Mood Index (MMI). It constitutes six different aspects. This comprehensive analysis shows a picture of market sentiments. It ranges between 0-100. The higher the score, the better the market sentiment.
Different zones of MMI are depicted in this picture:
- Moving averages
The average price of securities over days is known as the moving average. For example: 10 days, 50 days, and 200 days moving average. It indicates how investors have perceived the stock for the last few days.
- Bullish Percent Index (BPI)
The market sentiment of bullish or bearish movement is indicated by the BPI. It is the bullish pattern in a specific index. The sentiment of sellers and buyers in the market is indicated by this index.
- Put-call ratio (PCR)
The put-call ratio (PCR) indicates the market sentiment. If it is more than 1, then it shows that there are more puts in the market or the investors are in the mood to sell more. Vice versa when the PCR is less than 1.
- Market breadth and volume
The number of stocks that rise or fall in the given index for a trading day is known as market breadth. The market volume is the number of stocks traded in the market. These two indicators show the investor’s attitude towards the market for a particular trading day.
- Commitment of Traders (CoT) report
The traders in the market indicate their preferences and confidence in the market through Commitment of Traders (CoT) reports. Usually, the flow of this report is against the market.
Historical instances
- General Elections 2024
Due to confidence in the existing government, there was a huge buying in the stock market before the results of the General Election of 2024. However, this optimistic sentiment did not last long when the results were announced on June 4, 2024. The public sector units (PSU) stocks experienced a decline of nearly 5% to 7%.
The day was clear evidence of how market sentiment evolves. The India VIX on June 4, 2024, closed at approx 26%. Moreover, most days near the result experienced high India VIX near the level of 20%.
- India-Pakistan tension defence
After the Pulwama attack on February 14, 2019, the following week, from February 21 to March 1, experienced a surge in defence stock due to cross-border tension between India and Pakistan. Defence stocks such as Bharat Dynamics went up nearly 15%, along with other stocks such as Hindustan Aeronautics, Bharat Forge, etc. However, this war-like situation led to an over 1% decline in the NIFTY 50 index.
- Ronaldo Coca-Cola
On June 14, 2021, in a pre-match press conference, the legendary football star moved two Coca-Cola bottles and said ‘water’ in front of the media. Social media picked this news, and it spread like wildfire in the investors. Following this, Coca-Cola lost $4 billion of market value. However, on the same day, Coca-Cola also became ex-dividend – a more prominent reason for this downturn.

Conclusion
The market prices are driven by the demand and supply forces of securities. However, this demand and supply is the reaction of market sentiment. The attitude of investors in the form of optimism, pessimism or neutrality decides the market sentiment. Analysing them with a proper market knowledge gives the investor an edge over others in the market.
DISCLAIMER: This article is not meant to be giving financial advice. Please seek a registered financial advisor for any investments.

- Section 80C Investments: Complete List to Maximise Tax Savings - July 8, 2026
- Top 10 Stocks to Watch in India: June 2026 - July 2, 2026
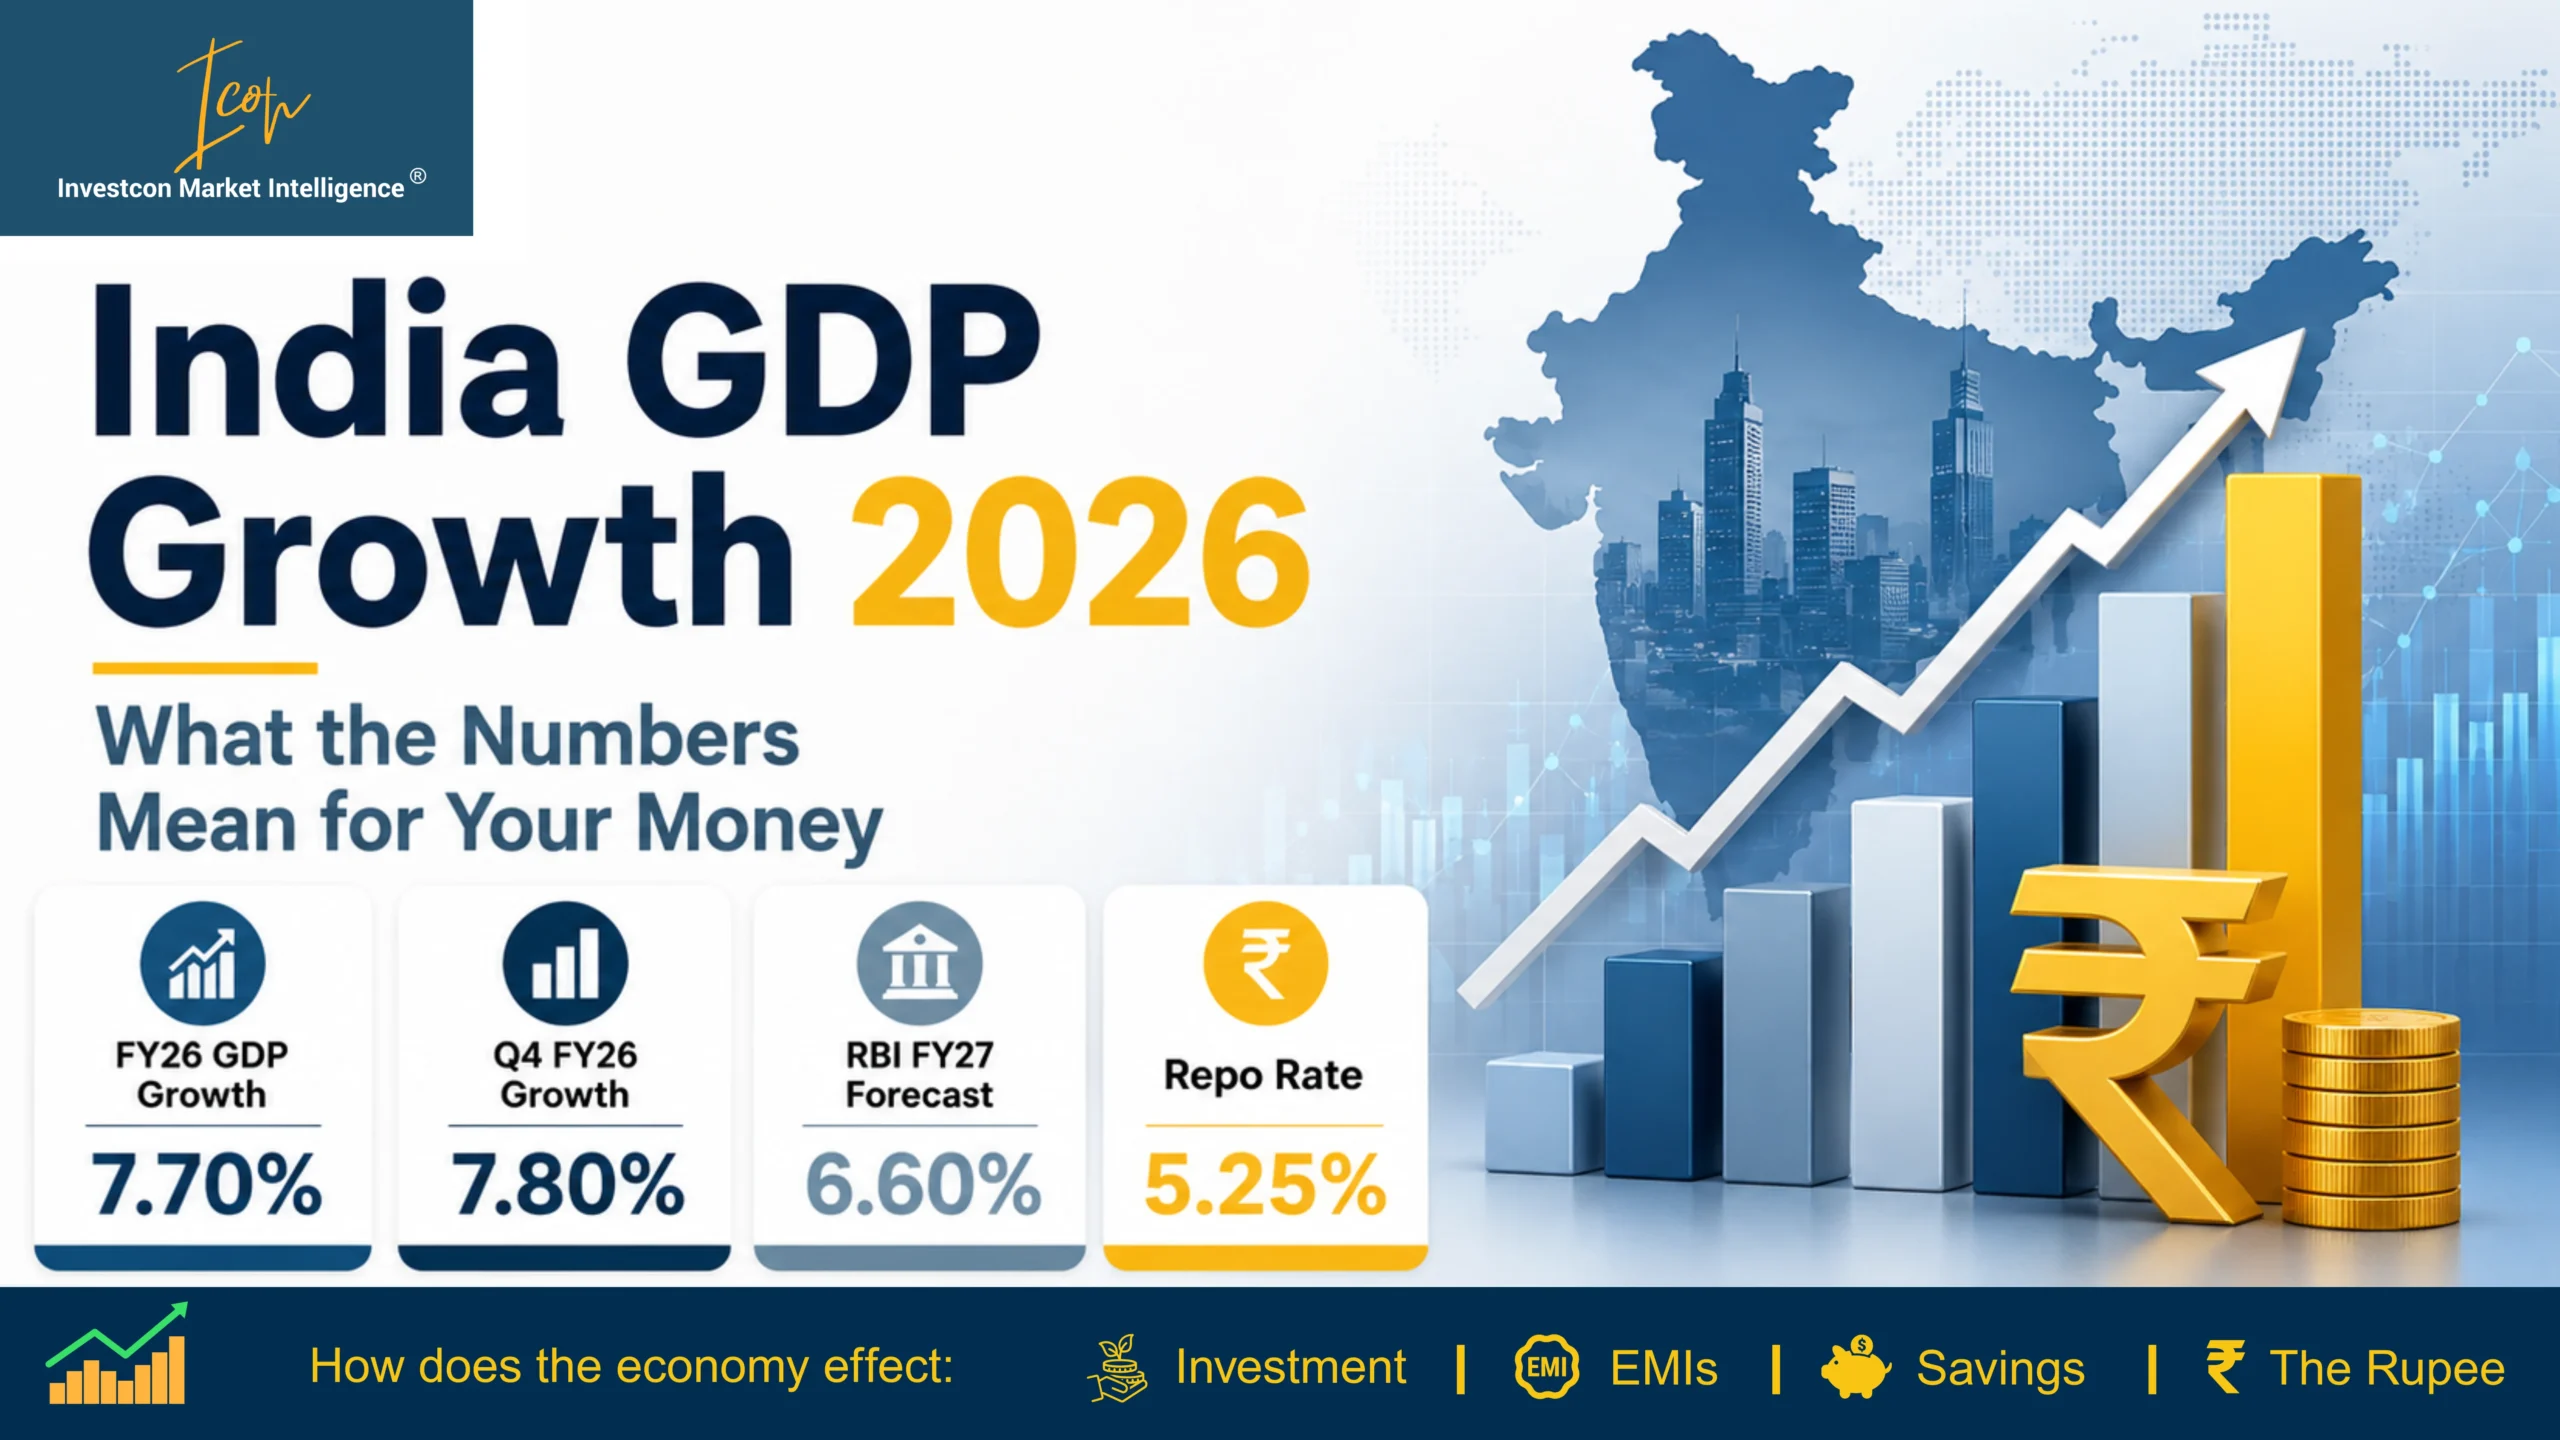
- India GDP Growth 2026 – What the Numbers Mean for Your Money? - July 2, 2026