Understand the concept of moving averages in technical analysis and its types. Also understand how it can be used for understanding market movements.
The moving averages have multiple uses in technical analysis. This technical tool can be used for trend identification to create trading indicators. Understanding the moving averages can enhance your trading experience significantly. This blog provides insights into moving average strategies, their uses, and limitations.
What are Moving Averages in moving average strategies?
Moving averages are a technical tool that smooths out the price data by finding an average price for the given number of days and removing the short-term price volatility (or fluctuations). With every new price candle that forms on the price chart, the moving averages update themselves.
Depending on their trading style and the market mood, different types and different durations of moving averages can be used.
Types of Moving Averages
There are three major types of moving averages used for moving average strategies technical analysis:
Simple Moving Average (SMA)
SMAs calculate the average price for a given time period, thus giving an equal weight to each data point. As a new price point (a candle or a bar) is added to the chart, the simple moving average drops the oldest price data and adds the latest data.
Exponential Moving Averages (EMA)
EMAs use a multiplier, and instead of giving similar weight to all price points, they give more weight to recent price data and lesser weight to older price data. This way, EMAs react faster to price changes than SMAs.
Weighted Moving Average (WMA)
WMAs give weights to the price data in descending order. Suppose the WMA calculates the moving average for the last 20 periods. The most recent price data will get a weight of 20, then the next price point will get a weight of 19, and so on.
Moving Average Uses
Now, let us look at the methods through which moving averages can be used by traders for analyzing and trading the markets.
Trend Identification
Moving averages can be used as trendlines for identifying trends. They clearly show which way the price is trending. If the moving average is rising and the price is above the MA, it is an uptrend, and if the MA is sloping downwards with the price action below it, it is a clear downtrend.
For example, as can be seen in the weekly chart of ICICI Bank Limited, the 50-week EMA (red line) is acting as a trendline, clearly showing that the price is sloping upwards, thus confirming an uptrend.

Source: Tradingview, ICICI Bank Limited – Weekly Chart
Support and Resistance
Moving averages are also widely used as support and resistance points. Because traders often place buy and sell orders around moving averages, believing prices will revert to their average, moving averages can act as support and resistance levels.
For example, look at the weekly chart of ICICI Bank Limited, how the price has taken support at the 50-week EMA (marked by green arrows) and bounced back off the EMA.

Source: Tradingview, ICICI Bank Limited – Weekly Chart
This is a popular trading strategy among traders to buy stocks in an uptrend when the price pulls back to an EMA and then bounces back upward. This signals that buyers might be stepping in, and the trend is likely to continue higher. (For Educational Purposes Only)
Moving Averages as Indicators
Technical Indicators are built using different moving average. These indicators can be as simple as a crossover of two moving average or an EMA (fast moving) crossing a SMA (slow moving).
The indicators built using MAs can be used to confirm breakouts or obtain sell/buy signals.
For example, the MACD indicator or the 13-EMA and 26-EMA trading strategy is simply the difference between two EMAs, that is, the 12-period EMA and the 26-period EMA. When prices rise, the gap between 12-EMA and 26-EMA increases because 12-EMA is faster than 26-EMA. This results in the MACD index rising.
Moving Averages as Stop Loss
Stop loss levels can be determined using the moving averages.
To stay in a trend and protect their profits, traders frequently set stop-loss levels below a moving average. As an example, a trader who has a long position could place a stop-loss right below the 50-day EMA.
The moving average crossover strategies can also be used as exit signals. For example, a major crossover of two MAs or price breaking below a certain MA.
Key Considerations Before Using Moving Averages
While moving average can be powerful tools of technical analysis, they have some limitations that are important to consider.
Lagging
Since moving average are based on past data, they might give delayed signals. These might lead to missing a good chunk of the move when the trend changes.
For example, in the chart of the Nifty 50 index below, the markets started their downturn in September 2024, but the death cross (the 50-day EMA crossing below the 200-day EMA) was formed in mid-February. Any trader waiting for death cross formation would have already lost a significant amount of money. Golden cross and death Cross patterns are used widely for technical analysis.
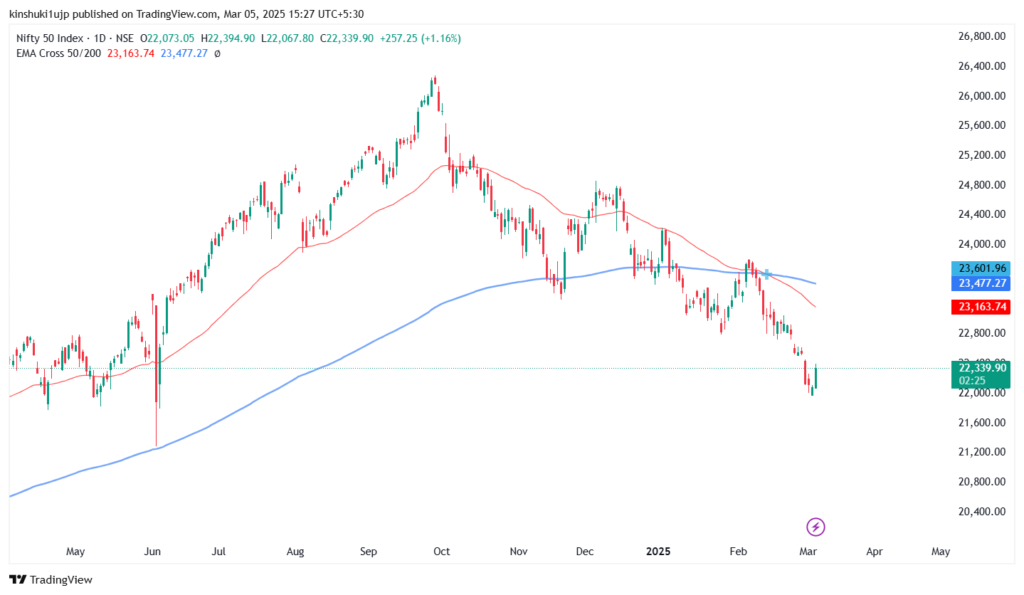
Source: Tradingview, Nifty 50 Index – Daily Chart
False Signals in Sideways Markets
Moving average give a large number of false signals in sideways markets. Acting upon these false signals can lead to large losses. So, traders can use other indicators along with moving average for higher reliability.
Equal Weight to All Data Points
Unlike EMAs or WMAs that give more weightage to recent data, simple moving averages give equal importance to all past data points, which may not reflect the latest market conditions accurately.
Discards the Oldest Data
SMAs can just completely discard away the oldest data when a new data point comes along, and sometimes that can mess up the trend.
Conclusion
Moving averages can be a great tool for analyzing market movements. MAs can also be used for trading signals, but they must be carefully crafted and back-tested. These moving average strategies can become even better when used with other technical analysis tools.
DISCLAIMER: The information given in this blog is for educational purposes only. Any content of this blog is not investment advice.

- Weekly Nifty 50 Trading Strategies and Technical Outlook - June 11, 2025
- Nifty 50 Trading Strategies and Technical Analysis - May 26, 2025
- Weekly Nifty 50 Technical Analysis: Key Trading Strategies - April 30, 2025