Table of Contents
This blog highlights the price action of the nifty 50 index on the budget day and key levels to watch out for in the coming days.
The Union budget 2025, introduced on 1st February 2025, saw some major income tax reforms. Budget highlights for income tax include revised tax slabs, offering relief to individual taxpayers, and boosting disposable income.
The Government also decreased capital expenditure in various sectors. Some analysts claimed that the budget was good due to tax reliefs, but some believed that the budget was not so good due to lower-than-expected capital expenditure.
In this blog, we will take a look at the reaction of broader market indices on the budget performance.
Nifty 50: Price Action on Budget Day
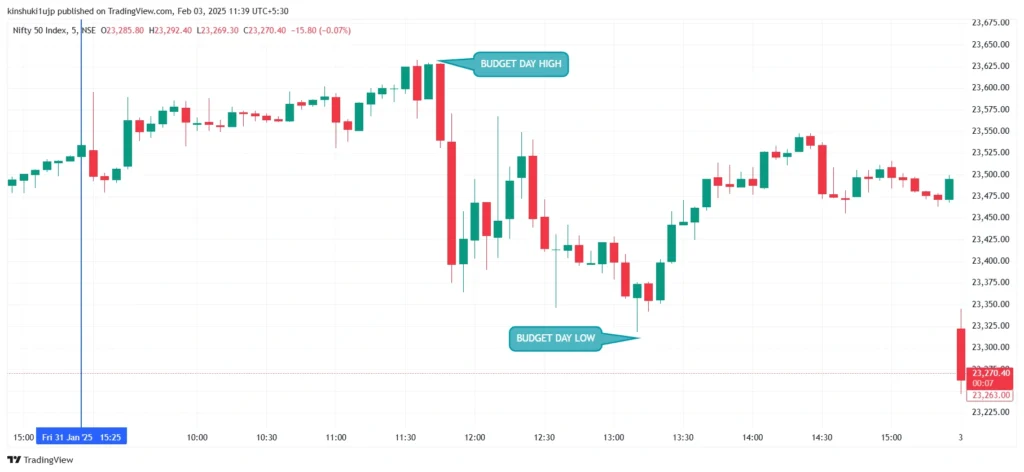
Source: Tradingview (Nifty 50 chart: 1st Feb 2025)
On the budget day, 1st February 2025, Nifty 50 index opened at 23,528. It made a high of 23,629 and a low of 23,318. The index closed at 23,495. This was a close 0.16% below the previous day’s close of 23,533. This shows the index was volatile throughout the budget day, but the closing suggests that markets were neither too optimistic nor too pessimistic about the union budget 2025 highlights.
Nifty 50: Technical Analysis

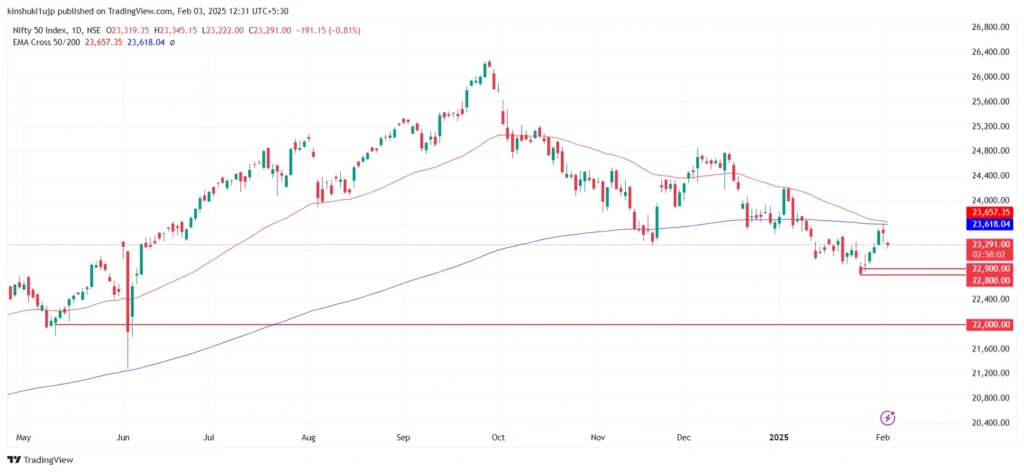
Source: Tradingview (Nifty 50 – Daily chart)
Looking at the daily chart of Nifty 50, we can see that:
- The red and green arrows on the daily chart mark the formation of lower highs and lower lows. This is a classic downtrend bearish formation.
- The index is also currently trading below its 50-day EMA (red line) and 200-day EMA (blue line). This is a bearish sign. Although, the 50-day EMA has not crossed below the 200-day EMA.
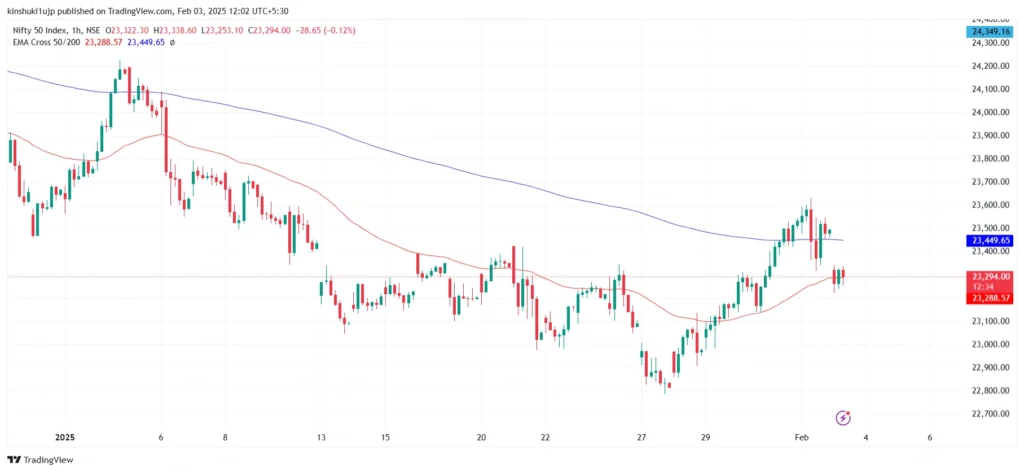
Source: Tradingview (Nifty 50 – 60 minutes chart)
Looking at a smaller timeframe chart (60 minutes) it can be observed that:
- The index is trading slightly below its 200 EMA. On the budget day, the index temporarily crossed 200 EMA, but later, it again slipped below these levels.
Nifty 50: Key Levels to Watch
Now, let us take a look at which key price levels and technical signals investors should watch to confirm a bearish or bullish move in the Nifty 50 index.
Bullish Move

Source: Tradingview (Nifty 50 – Daily chart)
To confirm a bullish move in the Nifty 50 index:
- Investors should wait until the index moves above its 200-day (blue line)and 50-day EMA (red line). If the index moves past these levels, there is no major resistance level until the 24,700 – 24,800 zone (horizontal green lines). This could be a positive signal.
- This move can be confirmed with the help of the Moving Average Convergence Divergence (MACD) indicator. If the MACD index moves above the zero line, it would mean that the Nifty 50 index is showing an up move with momentum, confirming the bullishness.
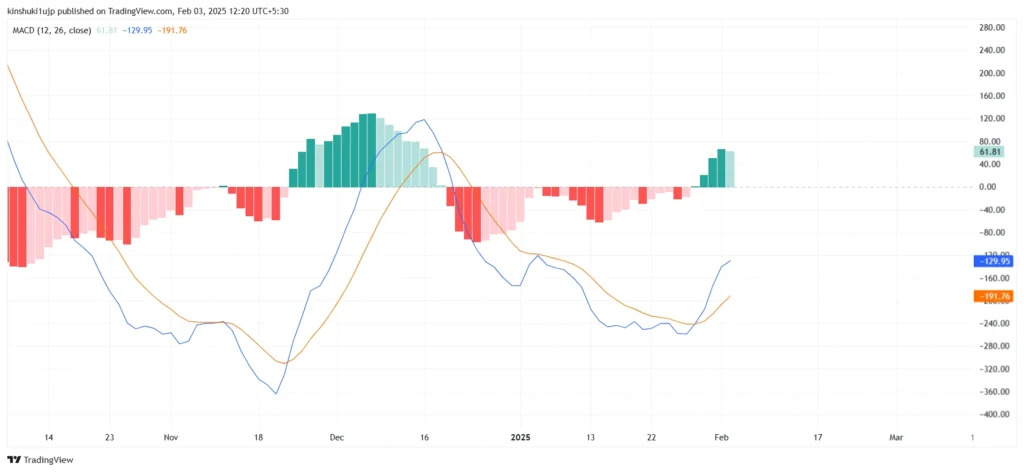
Source: Tradingview (Nifty 50 – Daily chart, MACD)
Any early signals for a bullish move can be observed in a daily timeframe chart. On the hourly chart, investors can wait for the 50 EMA to cross above 200 EMA. That can be an early sign for a bullish move.
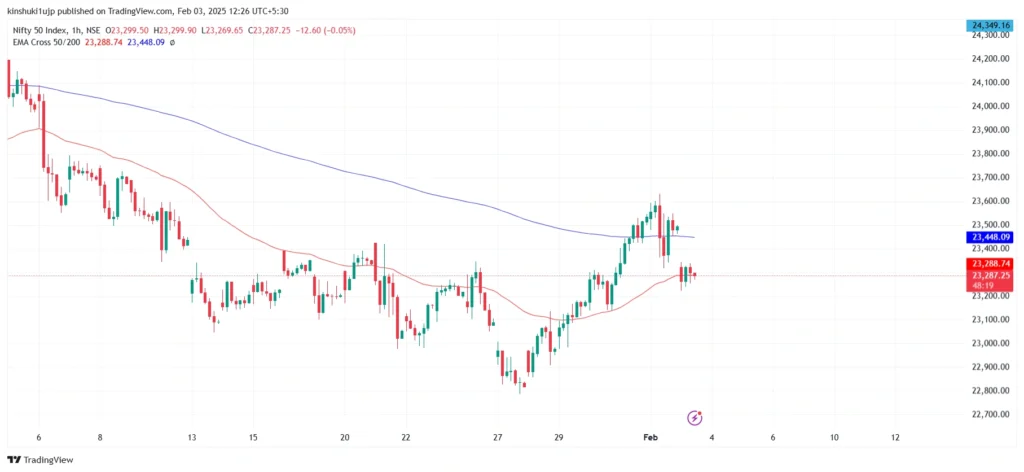
Source: Tradingview (Nifty 50 – 60 minutes chart)
Bearish Move
Source: Tradingview (Nifty 50 – Daily chart)
Investors must watch out for two major bearish signs on the Nifty 50 chart to confirm a bearish breakdown.
- The index is trading close to its immediate support level of 22,800-22,900 (two horizontal red lines). This zone will act as an immediate support for nifty 50. Any breach of this level can push Nifty 50 towards its next support zone at around 22,000 level.
- Investors must closely watch the 50 and 200-day EMAs. If the 50-day EMA crosses below the 200-day EMA, it can signal the formation of the death cross. Historically, death crosses on daily charts have been followed by prolonged downtrends.
These bearish signs can indicate possible future trouble for the index.
Top performing Nifty 50 stocks
On the budget day the top five best performing stocks were:
| Name of Stock | % return (on 1st Feb 2025) |
| Zomato Ltd. | 7.25% |
| Maruti Suzuki India Ltd. | 4.92% |
| Indian Hotels Company Ltd. | 4.81% |
| ITC Ltd. | 3.36% |
| Mahindra & Mahindra Ltd. | 2.91% |
The Government focused on the tourism sector and allocated Rs.20,000 crores. This is positive news for tourism stocks. Along with that, the government gave tax reliefs wherein salaried people earning up to Rs.12,00,000 per annum would not be paying any taxes. This announcement gave a major push to FMCG stocks because this move will increase the disposable income in the hands of the public. Let us look at which Nifty 50 stocks were the top laggards on the Budget day.
| Name of Stock | % return (on 1st Feb 2025) |
| HCL Technologies Ltd. | -1.82% |
| Ultratech Cement Ltd. | -1.99% |
| NTPC Ltd. | -1.94% |
| Larsen and Toubro Ltd. | -3.36% |
| Powergrid Corporation of India Ltd. | -3.91% |
The market participants and industry bodies in the infrastructure sector were expecting higher levels of capital expenditure than provided in the 2025 union budget. This was the main reason for the decline in cement, power, and engineering stocks.
Conclusion
Market participants should carefully watch for any bullish or bearish signals in the Nifty 50 index. The levels suggested above are not exact levels but an approximation of how a bullish or bearish move would look like. The exact impacts of the PIB budget 2025 will be seen in the prices of stocks and the Nifty 50 index in the coming weeks.
DISCLAIMER: This blog is for educational purposes only and it is not investment advice.

- Weekly Nifty 50 Trading Strategies and Technical Outlook - June 11, 2025
- Nifty 50 Trading Strategies and Technical Analysis - May 26, 2025
- Weekly Nifty 50 Technical Analysis: Key Trading Strategies - April 30, 2025