Weekly Nifty 50 Trading Strategies and Technical Outlook
June 11, 2025

In the first week of June 2025, from 2nd June to 6th June, the Indian stock market remained positive. The positive move was a result of the Indian central bank delivering a larger-than-expected repo rate cut. In this weekly Nifty 50 technical analysis blog, we will see what technical signals investors should watch. Market Recap: […]
Nifty 50 Trading Strategies and Technical Analysis
May 26, 2025

The Nifty 50 index closed 0.67% lower at 24,853 in the previous week (May 19 – May 23, 2025). This slightly negative move came after the market rallied almost 4% in the week before as a result of ceasefire news. Let us look at some weekly Nifty 50 technical analysis signals that traders can look […]
Weekly Nifty 50 Technical Analysis: Key Trading Strategies
April 30, 2025

Explore detailed weekly Nifty 50 technical analysis, and key support and resistance levels for the week, along with top trading strategies for Indian stock market investors. Last week, from 21st April – to 25th April 2025, the Nifty 50 index opened on a positive note as the investors were optimistic that the US government is […]
Weekly Nifty 50 Technical Analysis: Market Sentiment Decoded
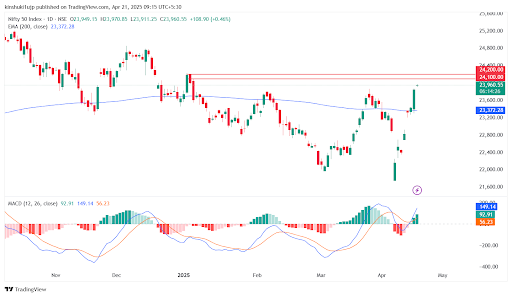
April 21, 2025

Stay updated with this weekly nifty 50 technical analysis report covering key events, and important price levels to help you navigate Indian stock market trends. Last week, from 14th – 18th April 2025, the Indian stock market was open for three days since Monday and Friday were public holidays. In the three trading days, the […]
Weekly Nifty 50 Technical Analysis: Market Update
April 14, 2025
With Trump Tariffs increasing investor worries, what are the key levels to watch in the market for the current week (14th – 18th April, 2025). Read to find out. Last week (7th – 11th April 2025), the stock markets witnessed high volatility as market participants worldwide gauged the impacts of the Tariff war between the […]
Stock Market Update:Weekly Nifty 50 Technical Analysis
April 7, 2025

Weekly Nifty 50 Technical Analysis: From technical analysis to trading strategies, get a complete view of Nifty 50 chart patterns and support/resistance levels. The current week, ranging from 7th – 11th April 2025 can be a volatile one for the Indian stock markets as the RBI will present its interest rate decision on 9th April […]
Weekly Nifty 50 Technical Analysis Update
April 1, 2025

Nifty 50 Market Insights: Get a clear view of the latest trends with key technical levels, FII/DII activity, and factors driving market sentiment. In the current week, the Indian stock market trends will be influenced by a variety of factors, including geopolitical events and price action. These events can increase the volatility in the markets. […]
Weekly Nifty 50 — Technical Analysis Update (as of early December)
March 24, 2025

Understand the Weekly Nifty 50 technical analysis trends! Get insights on key technical signals, FII flows, and market sentiment in this weekly update. Stay ahead. The Indian stock markets have been struggling for quite some time amid volatile geopolitical events and overvaluation fears for stocks after the recent bull run. Let us take a look […]
Moving Averages Strategies in Technical Analysis
March 18, 2025

Understand the concept of moving averages in technical analysis and its types. Also understand how it can be used for understanding market movements. The moving averages have multiple uses in technical analysis. This technical tool can be used for trend identification to create trading indicators. Understanding the moving averages can enhance your trading experience significantly. This […]
Nifty 50 Forecast: Is the Market on the Verge of a Breakout or Breakdown?
February 24, 2025

As of February 2025, the Indian stock market is in a very confusing state for traders and investors. The market participants have mixed views, with some predicting a swift recovery for markets from the current lows and some predicting an upcoming market crash. This article provides a Nifty 50 forecast using technical analysis as of […]


