Technical analysis, the practice of using historical data and current price action to forecast future price movements, helps in identifying signals and patterns that provide an indication of market sentiment.
Traders use these signals to identify potential entry points, confirm price breakouts and set exit levels using support and resistance, technical indicators and trading volume. For those exploring technical analysis of stocks in India for beginners, the process involves identifying the market trend, confirming entry signals and planning exits with stop-losses and profit targets.
However, these indicators do not provide guaranteed predictions of price movements with certainty, so traders must combine chart signals with risk management and predefined trading rules. Practising these techniques on historical charts can help the beginners to understand how different indicators behave under changing market conditions before applying them to live trades.
Quick Answer:
Technical analysis helps stock market beginners in India identify potential entry and exit points by studying price trends, chart patterns, support and resistance levels, trading volume and indicators such as RSI, moving averages and MACD. Combining these signals with stop-losses, profit targets and risk management can support better trading decisions, although no indicator guarantees profits.
Key Takeaways
- Technical analysis can help in timing entries and exits by identifying trends, confirming signals and setting price targets.
- Traders also use moving averages, RSI, MACD and trading volume to evaluate entry signals.
- They further set stop-losses and profit targets in advance, combine signals and review past trades to manage risk.
Understanding Technical Analysis in Indian Stock Market
Technical analysis is a method of evaluating stocks by studying their historical price movements, trading volume and chart patterns to identify potential future price movements. Traders use it to assess market trends, determine possible entry and exit points and manage trade risk.
Unlike fundamental analysis, which examines factors such as earnings, debt and business performance, technical analysis focuses on market behaviour and price action.
For example, a stock that repeatedly rebounds from ₹480 may have a support level around that price. If its price repeatedly declines near ₹500, that level may act as resistance.
However, support or resistance is not a fixed price barrier. Both are zones where buying or selling interest has previously appeared, and either can fail when market conditions change.
Here is a recent market reference:
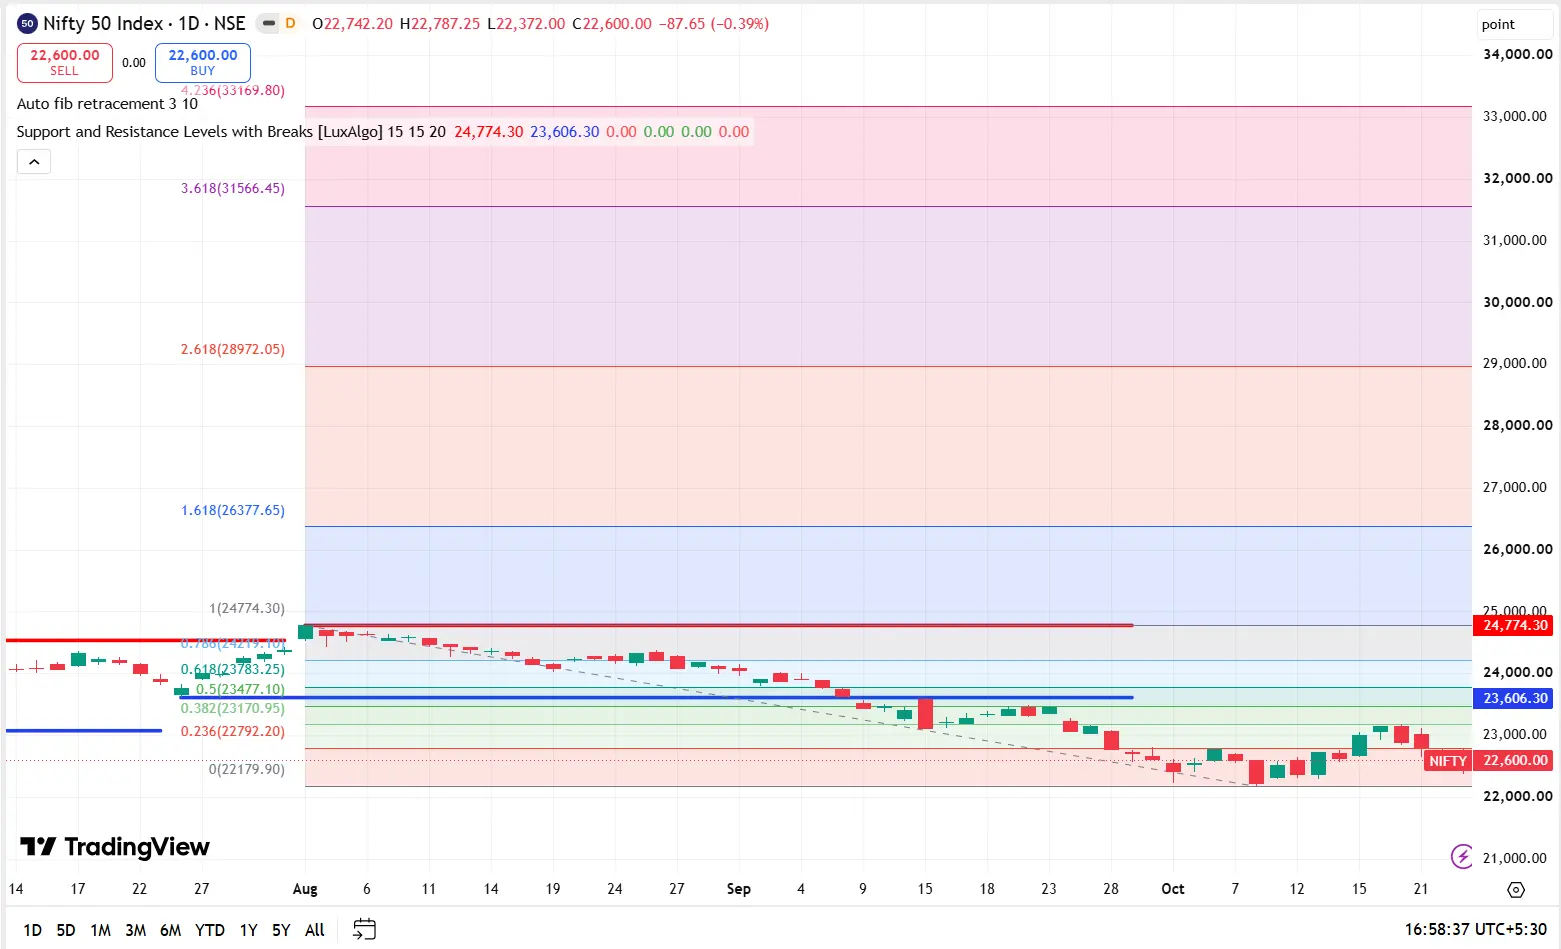
On 22 October 2026, the Nifty 50 fell 0.54% to close at 22,687.65, trading between 22,555.95 and 22,784.75, a range of 228.80 points.
The figures illustrate how the traders can examine the price range and percentage change of a session. However, the index’s movement alone does not establish whether an individual stock offers a valid entry signal.
Steps to Time Stock Entries and Exits Using Technical Analysis
The steps below explain how to assess market trends, interpret indicators, verify trading signals and manage risk when trading stocks:
1. Identify the Market Trend
Start by identifying whether a stock is in an uptrend, downtrend or sideways trend. This helps you decide whether to look for buying opportunities, selling opportunities or wait for a clearer signal.
An uptrend forms a series of higher highs and higher lows, which indicates that buyers are pushing the prices upwards. A downtrend, on the contrary, forms lower highs and lower lows, which suggests that the sellers are in control. Apart from this, when the prices move within a narrow range without making consistent highs or lows, the market is considered sideways.
You can use candlestick charts to study these movements and identify support, the price area where buying interest may prevent further declines, and resistance, the area where selling pressure may limit further gains. These levels can however break when market conditions change.
2. Use Indicators for Entry Signals
Technical indicators use price and volume data to assess the market direction and momentum. The following are three commonly used indicators for technical analysis of stocks for beginners:
- Moving averages: The moving average shows the average price of a stock over a set period, which makes its overall price direction easy to spot. When a shorter-period average moves above a longer-period average, it may signal that the stock price is starting to rise.
- Relative Strength Index (RSI): RSI measures how quickly and strongly a stock’s price has been rising or falling, on a scale of 0 to 100. A reading above 70 may indicate that the stock has risen sharply, while a reading below 30 may indicate a sharp fall. Neither guarantees a reversal.
- Moving Average Convergence Divergence (MACD): MACD helps identify changes in a stock’s price momentum. When the MACD line crosses above its signal line, it may indicate rising momentum. When it crosses below, it may indicate weakening momentum.
You can combine different indicators with the market trend and support-resistance levels to evaluate an entry signal. Additionally, you must avoid relying on a single indicator. For those learning technical analysis for stock market beginners, recognising these patterns is a useful first step.
3. Confirm Entries with Volume
Volume shows how many shares are traded during a given period. It helps assess whether a price movement has sufficient trading activity behind it.
For example, if a stock breaks above resistance at ₹500 with higher-than-average volume, the breakout has stronger confirmation than one accompanied by low volume. However, high volume does not guarantee that prices will continue rising.
Watch out for possible false breakouts, where the prices may briefly cross resistance before falling back below it. Waiting for the candle to close above resistance or checking for a successful retest can help in confirming the move.
When applying technical analysis Indian stock market strategies, consider volume alongside the trend, price action and other indicators before entering a trade.
4. Plan Exits Before Entering
Set a stop-loss and profit target before entering a trade. A stop-loss limits potential losses, while a profit target identifies where you plan to book gains.
In the case of a long trade, the next resistance level may serve as a profit target, while support can help determine the stop-loss level. While in short trades, support may act as a target and resistance as a stop-loss reference.
To assess this, the risk-to-reward ratio compares the possible losses with possible gains.
Risk-to-Reward Ratio = Potential Losses/Potential Gains
For example, if you buy a stock at ₹200 with a stop-loss at ₹195 and a target of ₹210, you are risking ₹5 per share for a gain of ₹10. So, the risk-to-reward ratio here is 1:2, before charges and slippage.
Additionally, a trailing stop-loss can help to protect gains as prices move favourably. However, significant price movements or market gaps may cause stop-loss orders to execute at a different price.
5. Combine Signals into a Trading Plan
Use the market trend, indicators, volume and exit levels together instead of relying on a single signal.
Let’s say a stock trades at ₹240 and forms higher lows below resistance at ₹250. It then breaks above ₹250 with higher-than-average volume. This may provide an entry signal if other indicators support the move.
The trader sets a stop-loss at ₹245 and a target at ₹260 that creates a potential risk-to-reward ratio of 1:2 before charges and slippage.
Record the reasons for entering, the planned exits and the trade outcome. You can review the past trades to identify which setups work under different market conditions. But you must note that no signal guarantees a profit, so risk management is essential.
Case Study: Wipro Tests Resistance
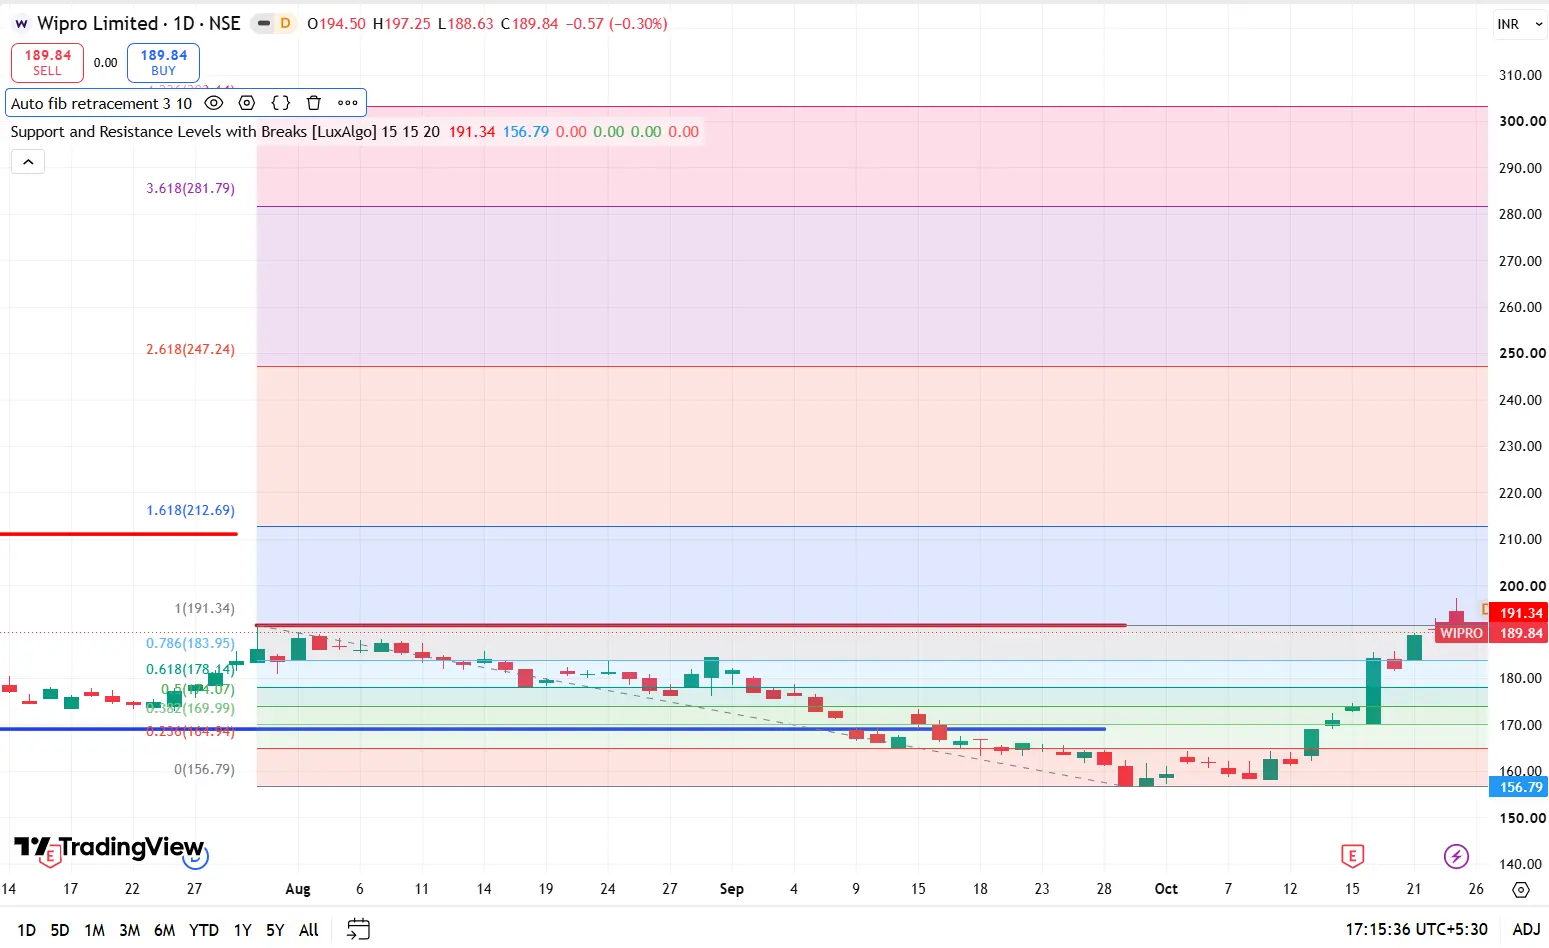
The share price of Wipro rose from ₹182.14 on 19 October 2026 to ₹190.41 on 22 October 2026. The stock traded in a range ₹188.97 to ₹192.88 on 22 October, while its volume increased to 4.59 crore shares from 3.78 crore in the previous session.
The beginners could use this price movement to assess a possible breakout:
- Identify resistance: The previous session high of Wipro at ₹189.75 was a level to watch. The stock closed above it on 22 October, suggesting a possible breakout.
- Confirm with volume: The trading volume increased from 3.78 crore to 4.59 crore shares approximately. While it supported the move, beginners should note that a high-volume session does not guarantee that the breakout will hold.
- Plan the entry: A trader might further wait for a sustained move above ₹189.75 or a retest of that level followed by renewed buying, instead of buying the stock immediately after its price crossed resistance.
- Define the exit: The trader generally sets a stop-loss below the level that invalidates the setup and identifies the next resistance using the historical chart. The target and stop-loss should be established before entering.
How to Practise Technical Analysis Before Trading
The following practices can help stock market beginners to evaluate trading signals, identify weaknesses and understand trading risks:
- Study historical charts: Beginners learning technical analysis of stocks in India can mark trends, support and resistance levels on historical charts. Comparing these levels with subsequent price movements helps assess potential trading opportunities.
- Practise paper trading: They can apply technical analysis to stocks for beginners through simulated trades. Even while learning, recording entry prices, stop-losses and targets helps to evaluate decisions, although simulated trading cannot fully replicate live execution or emotional pressure.
- Compare indicator signals: Traders can use moving averages, RSI and MACD to assess price trends and momentum. Practising technical analysis in the Indian stock market helps beginners recognise conflicting signals and understand indicator limitations.
- Review trading records: Technical analysis for stock market beginners can become practical when they keep track of entry reasons, exit decisions, risk-to-reward ratios and outcomes to identify recurring mistakes and evaluate strategies across market conditions.
- Include trading costs: Traders should further consider brokerage, Securities Transaction Tax (STT), GST, exchange charges and slippage while estimating returns. Ignoring these costs can make results appear more profitable than actual trading outcomes.
Common Mistakes to Avoid When Timing Trades
- Depending on one indicator: Traders may receive misleading signals from a single indicator. So they confirm the signals with price action and other relevant indicators to improve decision-making.
- Entering before breakout confirmation: Traders who enter before a candle closes beyond a key level may face a higher risk of false breakouts.
- Ignoring transaction costs: Brokerage, taxes and slippage can reduce traders’ actual returns, even when a trade reaches its target.
- Changing exit rules impulsively: Traders who move stop-losses further away or abandon profit targets without predefined reasons may increase their potential losses.
Conclusion
Technical analysis of stocks in India for beginners requires more than recognising patterns on a chart. Traders must judge whether a signal fits the market trend, check for confirmation and decide how much they are willing to risk.
Investcon explains how beginners can put these principles into practice by setting clear trade conditions, comparing potential gains with possible losses and reviewing their decisions to improve their approach over time.
FAQs
Q: How does technical analysis help time entries and exits?
Ans: Technical analysis helps the traders to evaluate price trends, momentum and possible breakouts. Traders use these signals to plan entries, set stop-losses and identify profit targets.
Q: Which technical indicator is best for entry signals?
Ans: The usefulness of an indicator depends on the stock’s price behaviour and market conditions. For instance, moving averages help identify trends, RSI measures momentum and MACD signals potential momentum changes.
Q: How do traders identify exit points in stocks?
Ans: Traders can identify exit points in stocks using technical indicators, chart levels and risk-management rules to lock in profits or cut losses before a trend reverses.
Q: Can RSI help determine when to buy or sell?
Ans: No, RSI should not be used alone to decide when to buy or sell. Readings above 70 may indicate overbought conditions, while readings below 30 may indicate oversold conditions. Traders should consider the trend and other signals before acting.
Q: How do you confirm a breakout before entering a trade?
Ans: To confirm a breakout before entering a trade, traders may look for a strong candle close beyond a key support or resistance level combined with an above-average volume spike and a subsequent retest of the broken level.

Lakshmi Sundari is a finance content writer and editor with over four years of experience across financial content and content strategy. She holds an MBA in Finance and writes on investing, personal finance and fixed-income markets. Her work spans long-form articles, PR, thought leadership, newsletters and social media, along with editorial planning and content strategy. She focuses on explaining financial developments and investment concepts through research-backed, practical writing.